Volume : 5 | Issue : 1
Research
Device for microtorque measurements for in vitro study of abutment fixation behavior
Luís Cláudio Aranha,1 Cristiano Stefano Mucsi,2 Francisco Carlos Ceoni,3 Eduardo José Nogueira,4 Jesualdo Luiz Rossi5
1DDS, MSc, Dr - Materials Science and Technology Center - IPEN
2Physicist, MSc, Dr - Materials Science and Technology Center - IPEN
3Electrical Engineer, MSc, Doctorate Student - Materials Science and Technology Center -IPEN/USP
4Graduation Student - Federal Institute of São Paulo - Scientific Initiation Student - IPEN
5Materials Engineer, MSc, PhD - Materials Science and Technology Center - IPEN
Received: December 25, 2022 | Published: December 31, 2022
Abstract
This paper presents the initial developments of a prototype device intended to perform measurements of the fastening torque in the range bellow 100 Ncm - called microtorque. The device is intended to yield data for analysis of in vitro torquing and detorquing experiments of fixation and removing of abutments in dental implants. The analysis of the data acquired allowed the authors to observe characteristic fingerprints or signal signatures associated to the type of abutment under experimentation as well as of the prototype. Two different systems of abutment and implant were analyzed. The correlation between the phenomena associated to the signal fingerprints indicate that the developed measurement protocol may be extended to other implant / abutment systems and other systems. The insertion and removal torque curves evaluated in this study, with the prototype device under development, will facilitated the correlation between the abutments stability in actual patients and the dynamical behavior under masticatory function.
Keywords: microtorque, implants, abutment, extensometer
Introduction
The control of the fastening torque of threaded elements (nuts, bolts, etc.) is an important manufacturing factor in industry equipment. This is due, if properly used, to the insurance of the repeatability of the tightening of fasteners, in the assembly lines of
machinery and equipment. These types of equipments are readily available and used in the automation sector. On the other hand, there are areas where the threaded elements grips should be performed with equal care, but with very low torque values, to avoid damage of parts, especially in dental implants, in which case, it must undergo tightening less than 60 Ncm.
This study aims to present the development process of a prototype device for measuring microtorques for the insertion and removal of threaded elements, such as those used in the field of dental implants. The choice microtorque subject was due to the scarce available literature about it, making it a very appealing subject. Moreover, this is an important field of study allowing the integration of diverse research areas, namely: mechanical; control; electronic signal; power electronics and; equipment design.
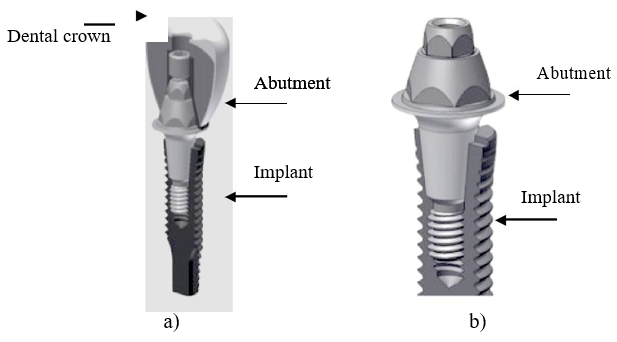
The dental implant consists of two parts, a device called an implant, which may be cylindrical or conical in shape with a central cavity and internal female thread, wherein the second device, the abutment, is fixed. Externally the implant has threads, which serve for locking into the bone. This group serves as a support structure for the dental prosthesis. The abutment according to the device described, it should be set to the implant in an accurately and stable way, to withstand masticatory forces, see Figure 1a & Figure 1b.
|
Figure 1 a) Illustration of three parts of a dental prosthesis: implant, abutment and dental crown. b) A higher magnification illustration focusing on the adaptation detail of the device. |
These parts are available in the specialized trade with a huge variety of shapes and sizes; the choice of the type or size is carried out based on the pre-surgical planning performed by skilled professional taking into account the conditions of the chosen site, the prosthetic planning and the manufacturer's guidelines.
The design of osseointegrated dental implant and the bone density and location to be inserted, have much influence on such device installation torque. The dimensions ranging from 3.5 mm to 5.0 mm in diameter and height can range from 5 mm to 21 mm. Bone marrow consists of an internal layer of highly irrigated tissue, and an outer layer, called the cortical, where the tissue is compact. The performance of the dental implant depends particularly on the stability of the device during the healing process of osseointegration within the factors chosen by the clinician. To achieve this important stability one can single out two important factors, the implant design and the surgical technique to be used. Lioubavina-Hack et al1, (2006) and Barewal et al2, (2003) state that in the absence of stability occurs the formation of a soft tissue capsule around the implant damaging the load bearing capacity of the tooth during mastication. Currently it has been observed that high insertion microtorques can hinder the healing process especially, microtorques above 60 Ncm. At higher microtorque high local heating occurs generating cells dehydration and microfractures of cancellous bone implying in bone necrosis and healing failure.
The longevity of the dental rehabilitation through implants is ensured if one always respects the properties of the involved materials. In this sense, the microtorque control is an important tool in this assurance. The parts should be tested by companies and installation protocols must be well designed keeping the microtorque to safe values within the limits of the used alloys.
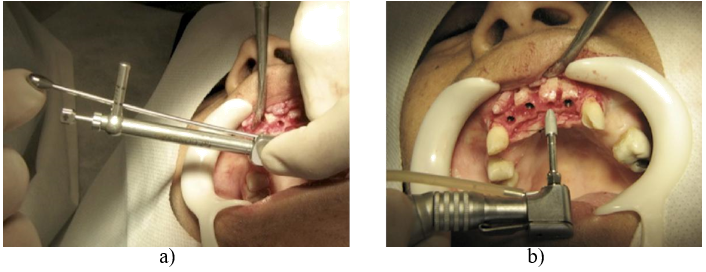
For this to occur, the microtorque wrenches must demonstrate actual values. In 2002, Standlee et al3 and Tan & Nicholls4, rated the degree of inaccuracy in the microtorque wrenches used in the installation of implants. The data showed a 15% to 48% change of the desired microtorque. Inexperienced surgeons tend to give an under microtorque whereas more experienced tend to overdue it. Failure to achieve the desired preload decreases the chance of a satisfactory implant insertion. Therefore, the microtorque wrenches must be tested periodically. However this measurement is made by a digital microtorque wrench that provides a low number of data so as to achieve the precision required in the process. Norton5 1999 and Elias6 2006, concluded that the abutment unfasten is always less than the tightening microtorque. Therefore if microtorque values are not so closest as possible to the specified ones, a certain possible failures may occur. For torque control it was used a ratchet rod or a click torque wrenches; and/or a dental contra-angle hand piece with torque control, as shown in Figure 2a & 2b.
|
Figure 2 a) Manual ratchet with stem for torque control. b) The dental contra-angle hand piece used for implant insertion. |
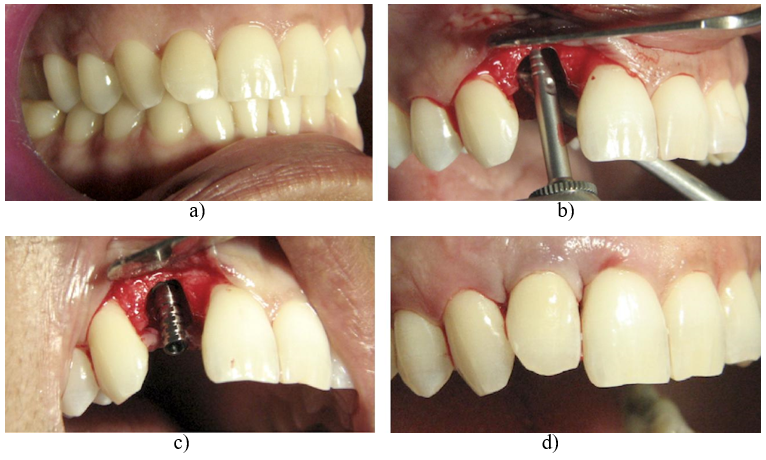
Hence, the microtorque control has many uses in implantology, and this becomes an important element to be filed and studied at the extreme, always seeking the lowest possible complications. Figure 3a-d demonstrating proper handling of instruments and parts and surgery finishing with a provisional functional tooth and with aesthetic quality (Anthogyr® System).
For this patient was bone and apical root reabsorption was occurring, as observed in an tomography not shown in this article, indicating an implant necessity.
Experimental
The authors present the methodology applied in the development of a prototype device to be used in the studies of microtorque observed during the insertion of dental implants and prosthesis abutments during in vitro experiments.
The project
The project for microtorque measurement prototype device was planned with the following sections (Mucsi et al7, 2014): layout and design; microtorque bar project and extensometry electronics; microtorque bar precise linear movement; mechanical drive of the sample holder; step motor programmable electronic interface.
Layout and design
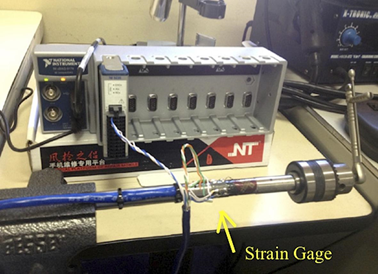
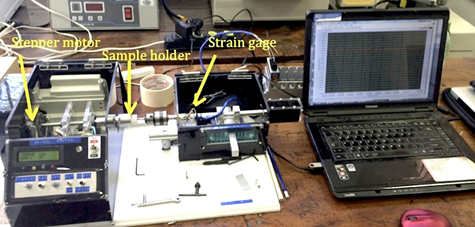
The principle of operation of the prototype is simple. A sample holder is turned by means of an electronically controlled stepper motor while the abutment is linearly inserted in the implant fixed to the holder. The prototype device projected and constructed is shown in Figure 4. From left to right one can see the mechanical drive (stepper motor and gears), the drive shaft and bearings, a flex joint and a sample holder. The axis of the apparatus was aligned from the drill chuck to the microtorque bar (which holds the strain gage) to a 0,01 mm/m linear precision. The microtorque bar is fixed to a precision linear bearing and rail, which allows for a free and precise linear movement of the abutment or implant when it was being inserted. The characteristics of the prototype device are summarized in Table 1 and the project can accept modifications, both hardware and software.
|
Figure 4 Image of the prototype device showing the main parts. The mechanical driver, torque sensing and data acquisition area shown. |
Description |
Range |
|---|---|
Microtorque range |
0 - 100 Ncm |
RPM (electronically controlled) |
0 - 200 RPM CW / CCW |
Easily programmable micro controller |
Arduino Atmel family |
High precision of shelf the parts |
H7 |
Table 1 Main characteristics of the prototype device constructed
CW - clockwise; CCW counter-clockwise.
The microtorque bar and the measurement electronics
During the prototype development various materials and dimensions where used in the construction of the microtorque bar. In Figure 5, a strain gage is bonded to a cylindrical the microtorque bar. A drill chuck, which holds the tool and sustaining and measuring parts, can be seen.
Aluminum alloy AlSi AA 5052 was used the in the construction of the microtorque bar described in this article. The known value for the elastic modulus of the alloy is 70.0 GPa (Polmear8, 1989). A sketch of the microtorque bar components is show in the Figure 6.

|
Figure 6 A sketch of the microtorque bar and components. Actually a two parts set, the left hand side one is a thin wall aluminum tube. |
Strain gage
Strain gages are widely used for the determination of stresses in structures either in the industry or in research and development. The working principle of strain gage relates the observed passive electrical resistance to the strain applied to it. In practical terms, once the strain gage is bonded to the surface of the material, it will respond to strain applied to the material varying its electrical resistance. Since stress and strain are linearly related in the elastic portion of stress x strain curve, it is not difficult to relate a measured electrical resistance of the strain gage to a stress applied to the material to which it is bonded. If the geometrical shape and dimensions of the piece or part is known, then the relationship between force to electrical resistance or microtorque to electrical resistance may be found. In the prototype under development in this paper, the authors determined the twisting microtorque as a function of the electrical resistance of a strain gage, bonded to a cylindrical bar subjected to a shear strain or angular deformation.
The Wheatstone bridge
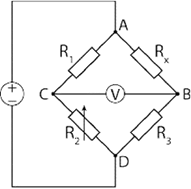
Since strain gages electrical resistance response to strain shows low-level signal, the measurement is best done with a Wheatstone bridge. Wheatstone bridge is an electrical circuit set up of four resistors. Referring to Figure 7, when an input voltage is applied to points (A) and (C), two different conditions are of interest. First, when all resistors have the same value the voltage across points (B) and (D) is zero. When one of the resistors has a different value the voltage across (B) and (D) differs from zero and is easier to measure at low-levels than low resistance values. In fact ohmmeters relies on the voltage drop through a resistor when an electric current is applied to it. To make things practical, strain gage extensometry uses a strain gage as one of the resistors of the Wheatstone bridge. The result is the stress or strain is determined in function of a voltage measured across the Wheatstone bridge. Usually the voltage is within the milivolt range and for normalization purposes it is expressed in mV/V, where V is the input voltage applied to the Wheatstone bridge (Ceoni et al9, 2012).
|
Figure 7 Schematic drawing of the classical Wheatstone bridge showing its main components and measuring points. |
National Instruments virtual instrument and hardware
Due to the low level voltage observed in the strain gage response to the applied microtorque, a National Instruments CompactDaq® chassis was chosen to set up the data acquisition system. A NI 9235, 8-channel quarter-bridge strain gage module, allows full 10 kS/s (kilo-samples per second) data acquisition with 24 bits resolution and was connected to a strain gage type KFC-10-D16-11. The data acquisition system is completed with the LabView® graphic and programming environment. A Bessel filter was applied to a 1 MHz input signal that was then file logged for further analysis.
Microtorque bar precise linear movement and mechanical drive of the sample holder
The mechanical assembly of the device provides linear movement of the microtorque bar, by means of a precision linear guide (flanged H type). The rotation of the sample holder was performed fixing it to a hollow cylindrical base/sample frame. The sample holder was placed at the tip of a shaft by means of a flexible joint. The shaft was supported by precision bearings. At the other end of the shaft a gear set provides a 19.58:1 reduction of the rotation from a unipolar stepper motor.
Stepper motor programmable electronic interface
An Atmel AVR microcontroller was chosen as the stepper motor driver controller interfaced by an Schotky bridge. In order to complete the set up, an application was developed allowing the control of the motor speed and its direction as well as the ability to receive external signals from the data acquisition system. A LCD displays the main information of the operation.
Testing and validation of the prototype device
For the validation of the operation and applicability of the device under development, the following protocol was proposed and tested: definition of the sample holder material and its dimensions; type of implant and insertion protocol; types of abutments; brand and insertion protocols; calibration procedure - microtorque against mV/V curve plot; torquing and detorquing the abutments and its characteristic signals.
The polyoxymethylene or polyacetal was chosen as the sample holder material due to its stiffness, low friction and excellent dimensional stability. The sample holder was 22 mm in diameter and 20 mm long to comply with the needs of other experimental procedures to be published. The commercially “Pross Dabi Implantes®” implants were used in the experimental part of this work.
Two Morse tapered type abutments were used in this experimental work procedure: index abutment and solid abutment. The choice was done to provide torquing data on two significantly different abutments systems. Figure 1a & 1b contain images of the system cross sections. It is important to note that in the solid abutment system, the contact surface formed between the Morse cone abutment and the implant is a shear frictional, because the screwed tip of the abutment is part of the body as the cone itself. For the index abutment system, a bolt is placed through the cone, pressing it into the implant as the screw is tightened.
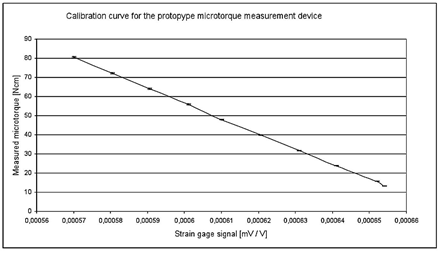
A calibration procedure was devised, using a set of known weights being hang at the tip of a bar with know length, the horizontal deflection angle was recorded for each weight together with the signal generated in the microtorque bar strain gage. The accuracy of the experimental data was used to derive the microtorque accuracy by the method of propagation of uncertainty . The results are summarized in Table 2. The applied microtorque and measured signal are shown in the first and third columns while the second and the fourth columns contain the derived uncertainty for the applied and uncertainty for the measured signals, respectively.
Applied torque Ncm |
Measured torque uncertainty Ncm |
Measured signal mV/V (assigned to the torque bar shear deformation) |
Measured signal uncertainty mV/V |
|---|---|---|---|
13.19 |
0.19 |
0.0006540 |
0.000005 |
15.77 |
0.08 |
0.0006520 |
0.000005 |
23.82 |
0.12 |
0.0006410 |
0.000005 |
31.86 |
0.16 |
0.0006310 |
0.000005 |
39.95 |
0.20 |
0.0006205 |
0.000005 |
47.90 |
0.24 |
0.0006100 |
0.000005 |
56.03 |
0.28 |
0.0006010 |
0.000005 |
64.10 |
0.32 |
0.0005905 |
0.000005 |
72.15 |
0.36 |
0.0005805 |
0.000005 |
80.68 |
0.40 |
0.0005700 |
0.000005 |
Table 2 Applied torque Ncm against microtorque strain gage bar signal mV/M
In Figure 8 the microtorque bar strain gage signal mV/V is plotted against the applied microtorque Ncm and is used as a calibration curve for the prototype device at the time of the experiments. Is important to note that if any geometrical modification is made in the microtorque bar and its associated parts a new calibration must be performed.
|
Figure 8 The microtorque bar strain gage signal mV/V is plotted against the applied microtorque Ncm. This data was used as a calibration curve for the prototype device. |
Once the calibration procedure was performed and the relation between microtorque and measured signal was established it was possible to start the experimentation with the abutments. In the curve of Figure 8 it must be noted that the uncertainty bars both for the applied microtorque and the strain gage signal cannot show up due to its small size. However, the measurement reproducibility evaluation showed a high dependence of the environment and device temperature. Thus, a carefully air-conditioned laboratory is required for these type experiments.
For the sake of investigation of the elapsed time evolution of the microtorque behavior during the insertion and removing of the abutments, two sets of experiments were planned one for each type of abutment. The experiments run continually and the torquing and the detorquing of six solid abutments and seven index abutments were recorded. The maximum applied microtorque was 20 Ncm or 0.000645840 mV/V signal from the strain gage on the microtorque bar.
Results and Disscussion
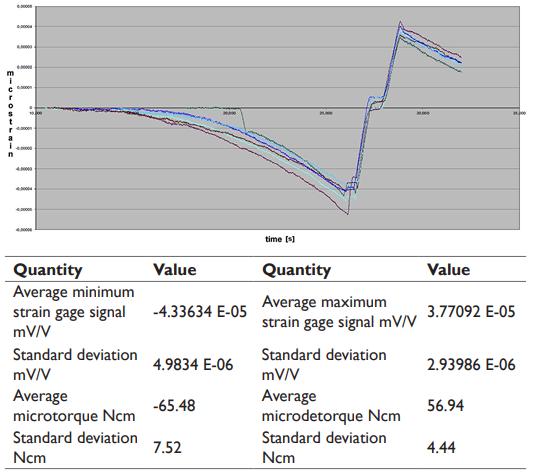
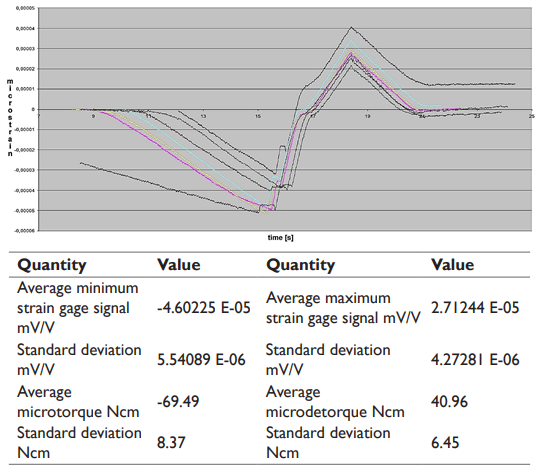
The results of the two sets of experiments of torquing and detorquing are summarized in Figure 9 & 10. The microtorquing - microdetorquing elapsed time evolution curves were analyzed. The results clearly show a signal fingerprints for each type of used abutment.
|
Figure 9 Evolution of torquing and detorquing curves for the solid type abutment. Average values and the standard deviation are shown. |
|
Figure 10 Evolution of torquing and detorquing curves for the index type abutment. Average values and the standard deviation are shown. |
The observed discrepancies of maximum applied microtorque in the abutments for its insertions, chosen as 60 Ncm, is due to a time lag system for the rotation inversion, not due to any mechanical error of the project. For the solid abutment system the microtorque discrepancy was 11.5 % and the microdetorque discrepancy was 7.8 % while for the index abutments system the same uncertainty were 12.0 % and 12.9 %, respectively.
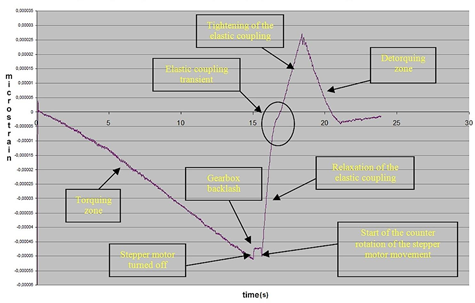
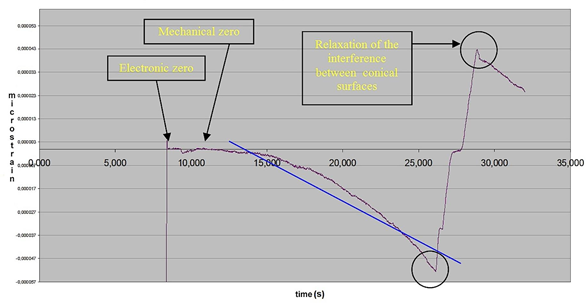
From the analysis of the curve in Figure 11 for the solid type abutments, the authors observed that there is a typical signal fingerprint for this kind of abutment and that the curve may be divided in three different zones. The microtorquing zone is characterized by a non-linear behavior between microtorque and time. A transient zone that occurs after the rotation sense inversion and the detorquing zone. The non-linearity observed in the microtorquing zone is believed to be caused by the friction between the two conical surface of the implant and the abutment. The transient zone has the same behavior as the one observed for the index abutment indicating that this behavior is exclusively associated to the prototype device intrinsic movements. At first a reduction of the microtorque soon after the switching off of the microtorquing movement is believed to be associated to the spring back of the steps of the stepper motor and to the gearbox backlash. An horizontal period may be observed and represents the time between the switching off of the microtorquing movement until the beginning of the microdetorquing movement. Follows two linear lines that are related to the intrinsic behavior of the elastic coupling between the drive shaft and the sample holder as formerly explained, and also a characteristic of the prototype device. The detorquing zone of the curve shows a peak that is associated to the removal of the friction interference between cone surfaces of the implant and the abutment followed by the final detorquing of the screwed tip of the abutment.
|
Figure 11 Fingerprint of the evolution of torquing and detorquing curves for the solid type abutment. |
For the index system of abutments, the curve is shown in Figure 12 and exhibits the characteristic signals fingerprint. The transient zone has the same behavior observed in the solid system of abutments again associated to the mechanical characteristics of the prototype device. The microtorquing characteristic of the index abutment is mainly linear and is associated to the microtorquing of the screw. The slight non-linearity of the microtorquing zone is due to the increasing effort needed to insert the abutment into the implant but is far from the observed non-linearity in the solid abutment torquing behavior. The microdetorquing zone does not exhibit the characteristic peak observed in the solid abutments characteristic signal. The curve is almost linear because the abutment stays fixed in the implant during the screw microdetorquing unlike the observed behavior of torquing zone.
Conclusion
The project and building of a prototype device under development and presented at this paper, yield an equipment capable o measuring microtorques for dental implant and abutment insertion analysis and protocol evaluations. The measurement reproducibility was evaluated and showed a high dependence of the environment and device temperature. The device signal fingerprint is characteristic of the assembly indicating that the calibration procedure must be carried out after any geometrical or mechanical modification. The development of the measurement process allowed the authors to analyze the mechanical interaction between the implant and the abutment for two different systems. The correlation between the phenomena associated to the signal fingerprints indicate that the developed measurement protocol may be extended to other implant/abutment systems and for other implants manufacturers.
Finally, the correlation between the abutments stability in actual patients and the dynamical masticatory behavior will be facilitated with the developed prototype device.
Acknowledgements
The authors acknowledge CAPES and CNPq for scholarships to Ceoni F. C. and Nogueira E. J., respectively..
Conflicts of Interest
The author declares no conflicts of interest.
References
- Lioubavina-Hack N, Lang NP, Karring T. Significance of primary stability for osseointegration of dental implants. Clin Oral Implants Res. 2006; 17:244-50.
- Barewal RM, Oates TW, Meredith N, Cochran DL. Resonance frequency measurement of implant stability in vivo on implants with a sandblasted and acid-etched surface. Int J Oral Maxillofac Implants. 2003; 18(5):641-51.
- Standlee JP, Caputo AA, Chwu MJ, Sun TT. Accuracy of mechanical torque- limiting devices for implants. Int J Oral Maxillofac Implants. 2002; 17(2):220-24.
- Tan KB, Nicholls JI. The effect of 3 torque delivery systems on gold screw preload at the gold cylinder-abutment screw joint. Int J Oral Maxillofac Implants. 2002; 17(2):175-83.
- Norton MR. Assessment of cold welding properties of the internal conical interface of two commercially available implant systems. J Prosthet Dent. 1999; 81:159-66.
- Elias CN, Figueira DC, Rios PR. Influence of the coating material on the loosing of dental implant abutment screw joints. Mater Sci Eng C Mater Biol Appl. 2006; 26:1361-66.
- Mucsi CS, Rossi Jl, Jesus ERB, Aranha LC, Ceoni FC, Nogueira EJ. Technology developments and device for measuring torque of threaded fastening elements. In: Annals of CONCISTEC'14, 5th Scientific Congress and Technological Week - IFSP, 20-24 Oct. 2014, Bragança Paulista, SP, Brazil, 2014. (In Portuguese)
- Polmear IJ. Light alloys, metallurgy of the light metals. 2nd Ed. New York, Chapman and Hall. 1989; p. 3.
- Cione FC, Rossi JL, Souza AC, Delijaicov S, Colosio MA. Residual stresses measurements using strain gages - aluminum wheels. Mat Sci Forum. 2012; 727-28:1925-30.
