Volume : 1 | Issue : 1
Research
Effect of length-to-diameter ratio on axial velocity and hydrodynamic entrance length in air-water two-phase flow in vertical pipes
João F Chidamoio, Lateef T Akanji, Roozbeh Rafati
School of Engineering, University of Aberdeen, AB24 3UE, UK
Received: December 04, 2017 | Published: December 19, 2017
Abstract
The effect of pipe length-to-diameter ratio (L/D) on air-water two phase slug flow regime development is hereby investigated. Axial velocity along the leading Taylor bubble and hydrodynamic entrance length required to establish a fully developed parabolic profile were critically assessed. The eccentricity distribution of axial velocity on leading Taylor bubble stream and on its nose is observed in all the L/D geometry ratios. The radial component of the axial velocity profile in the liquid film ahead of the leading Taylor bubble is represented by a power law function; with exponent n=6.1 for L/D=833.3 and n=5.7 for L/D=1666.7. Despite a decrease in the exponent as L/D ratio increases, the full parabolic profile could not be reached. This suggests that further investigation on L/D ratio incorporating other inherent variables which are likely to affect the development of the full parabolic profile may be required
Introduction
In oil industry, complex multiphase mixtures consisting of oil, gas, water and possibly precipitated solids and/or formation sands may flow through the tubing with different flow regimes observed. The multiphase fluid flow development is important and has generated a lot of controversy in the literature. According to Brennen,1 in single phase flow, it is well established that an entrance length of 30D to 50D is necessary to create fully developed flow for turbulent regime. The corresponding minimum length for multiphase flow to be fully developed is not well established and it is quite possible that some of the reported experimental observations are for temporary or developing flow patterns as argued by Brennen, Wang.1,2 A group of authors has made similar arguments.3-5
Saffari et al.6 stated that in the fully developed flow region of a pipe, the velocity profile does not change downstream, and thus the wall shear stress remains constant, perfectly symmetrical and the radial component profile of the axial velocity is fully parabolic. However, this study did not analyse the flow behaviour prior to this fully-developed flow region. Morgado et al.5 argued that for fully developed continuous slug flow, no interaction between consecutive Taylor bubbles should occur. The bubbles rise at the same translational velocity with the length of the liquid slugs between them remaining constant.
Imada et al.7 observed a decay on slug frequency along the centre-line on air-water vertical upward flow in pipes. The point at which the slug frequency becomes constant along the pipe length is considered as the hydrodynamic entrance length. Therefore, a 60D entrance length was obtained. Paradoxically, an overestimation of slug frequency was obtained by comparison with a model proposed by Hernandez-Perez8 and an underestimation with a model proposed by Zabaras.9
Another group of authors10-13 have stated that for a fully developed gas-liquid two-phase upward slug flow, the translational propagating velocity is independent of the length of the Taylor bubble. The intricacies of obtaining fully developed gas-liquid flow relies on bubbles expansion caused by the pressure changes along the tubing as it rises from the bottom, leading to increase in bubble volume thereby affecting its motion.5,14-16 In their investigations, based on slugging frequency decay, Kaji et al. [14], concluded that the flow pattern as well as slug lengths may vary with the axial position. Although they did not find the exact axial distance at which the flow is fully developed, a Taylor bubble/liquid slug length of 100D was observed. Further, a gradual decrease of slug frequency was observed even at the furthest measurement point of 151.2D.
Rosa and Souza17 characterised the fully developed slug flow as one where the liquid and gas velocity profiles no longer change within the liquid slug, the neighbouring Taylor bubbles do not merge and the bubbles coalescence rate is null. It is generally expected that very long tubes are required to achieve fully developed continuous slug flow. This is as a result of the occurrence of bubble coalescence in the hydrodynamic entrance region where the alteration of the flow pattern along the tubing usually manifests.5,17-20
Chidamoio et al.,21 in their investigation on fluid flow development, observed a decay in exponent of the power law function as the pipe length increases; although, a full parabolic profile was not obtained at the highest investigated pipe L/D ratio of 166.6. This has necessitated the need for further investigation on the effect of L/D ratio on slug flow regime development in vertical pipes. In this paper, we therefore investigated via numerical simulation technique, the effect of L/D ratio on transient air-water slug flow development in vertically upward cylindrical pipe geometry at higher L/D ratios of 833.3 and 1666.7; and compared with L/D of 16.6, 83.3 and 166.7 reported in.21 Furthermore, we also investigated the fluid flow behaviour around the Taylor bubble.
Methodology
A numerical model is formulated to establish the variations of phenomenological behaviour in the parameters associated with two phase flow development by running sensitivity analyses on variables such as length to diameter ratio. The model’s dimensions are presented in Table 1.
| L/D | 50 m | 100 m |
|---|---|---|
| 0.067 m | 833.3 | 1666.7 |
Table 1 Length to diameter ratio (L/D) adopted in this investigation
Finite elements discretisation of geometries and model setup
The finite element method is applied in the discretisation of all the geometric entities into small simple shapes, such as tetrahedral or hexahedra in 3-dimensions. In order to discretise inside of the tubing and the surface walls of all geometric samples, an unstructured mesh consisting of tetrahedron and triangle elements are used and the mesh quality indicators presented in Table 2.
| Quality/Ratio | Minimum orthogonal quality | Maximum aspect ratio | Number of elements |
|---|---|---|---|
| L/D=833.3 | 0.826 | 2.63 | 64289 |
| L/D=1666.7 | 0.709 | 2.92 | 128578 |
Table 2 Sample mesh report
The mesh quality is characterised by the orthogonal quality ranges. The orthogonal quality ranges from 0 to 1, where values close to 0 correspond to low quality and values close to 1 are high quality and the maximum aspect ratio is required to be less than 5.22 As shown in Table 2, the mesh quality is within the minimum range required. Mesh qualities are improved by using high level diagnostic smoothening and modification algorithm in Integrated Computer Engineering and Manufacturing (ICEM) tool. Typical problems that may be associated with low mesh quality includes single, multiple edges, triangle boxes, overlapping elements, non-manifold and unconnected vertices.
Assumptions, boundary and initial conditions
The transient two-phase flow in vertical upward cylindrical pipe is assumed to be incompressible, immiscible, isothermal and with no mass transfer between the phases. Additionally, gravity and turbulence are taken into account, where the turbulence effects are evaluated by the use of the standard ,23 and Renormalised group (RNG) models combined with the standard wall functions approach.24
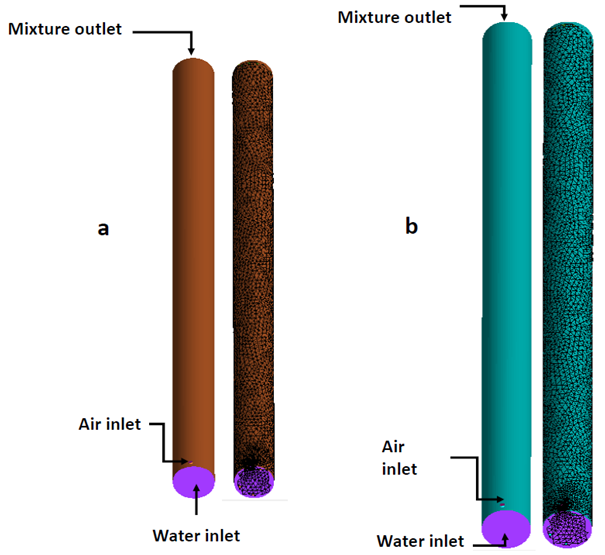
The inlet velocity for liquid phase is placed at the bottom of the tubing, while the gas inlet velocity was set at lower side of the tubing, see Figure 1. A Dirichlet boundary condition is applied in the inlet. The outlet boundary for the mixture is placed at the top of the tubing see Figure 1, where a pressure boundary condition (Neumann boundary condition) is applied at the outlet and it is set equal to zero Pascal, meaning that the outlet is open to the environment and the only pressure acting at the outlet is atmospheric pressure. The outer surfaces of the tubing are treated as wall with no slip23 and no penetration , where denote the unit tangent on the boundary and unit normal to the boundary, respectively. The initial conditions are presented in Table 3.
|
Figure 1: CAD and the corresponding finite element mesh for selected geometric models of L/D ratio (a) 833.3 and (b) 1666.7 |
| Velocity, | Density, | Viscosity, | Interfacial tension, | |
|---|---|---|---|---|
| Water | 0.1 | 998.2 | 0.00103 | 0.073 |
| Air | 0.5 | 1.225 | 0.0000179 |
Table 3 Fluid physical properties and initial conditions
Numerical simulations
The volume of fluid method, developed by Hirt,25 uses a phase indicator function, to track the interface between two or more phases. The indicator function applies values between 0 and 1 to distinguish between different fluids, which are considered as immiscible phases.
Governing equations
The flow of two-phases in a tubing can be described by the general form of the momentum equation, constrained by the mass conservation equation.
The momentum conservation equation can be written as:
| (1) |
Where, and U are the mixture density and mixture velocity respectively.
In Equation 1, the term (a) represents the rate of increment in momentum per unit volume; (b) is the change in momentum due to convection; (c) is the pressure gradient; (d) represents the viscous and turbulent contributions; (e) is the gravitational forces.
The mass conservation equation is written as:
|
|
(2) |
The surface tension is modelled by the Continuum Surface Force formulation proposed by Brackbill et al..26.
For the cell lying at the interface , the mixture density, dynamic viscosity and the mixture velocity U are related to the volume fraction and individual properties of phase k. Additionally, as closure relationship, elliptic equations are required for the Reynolds Average Navier Stokes (RANS) equations. This formulation can be found in Chidamoio et al..21
For each phase k present in the mixture, an additional transport equation, for its volume fraction needs to be included in the calculation, thus:
|
(3) |
where in Equation 3 is the source term.
Solution technique
Numerical simulation based on the finite volume method was carried out to solve the momentum equation (Equation 1), continuity (Equation 2) and transport equation (Equation 3). The domain is discretised into a finite set of control volumes or cells. Each transport equation is discretised into algebraic form by expressing the variation in the dependent variable and its derivatives, using interpolation profiles, in terms of the grid point values.27 Material properties, velocities are stored at cell centres and face values are interpolated in terms of local and adjacent cell values.22 Semi-implicit method for pressure-linked equations algorithm developed by Patankar and Spalding28 is applied. Additionally, under relaxation factors on pressure, momentum and turbulent kinetic parameters are set to be 0.3, 0.7 and 0.8 as suggested by ANSYS.22
Grid convergence and numerical validation procedure Mesh or grid independence study was carried out to determine the optimum point where a fairly accurate solution for the problem is found at the expense of least computational resources. Details of this procedure has been presented in.21
To test the code, a study on transient air-water flow in vertical upward was conducted and compared with the experimental measurements by Polonsky et al..29 The experimental test section facility consisting of 0.025m diameter and 4.0m length, was replicated by use of CAD tool and meshed in ICEM CFD. The numerical tests were carried out at axial distance of the test sections of 13.08, 13.12, 13.16, and 13.2 respectively. For more details readers are referred to.21
Results and discussion
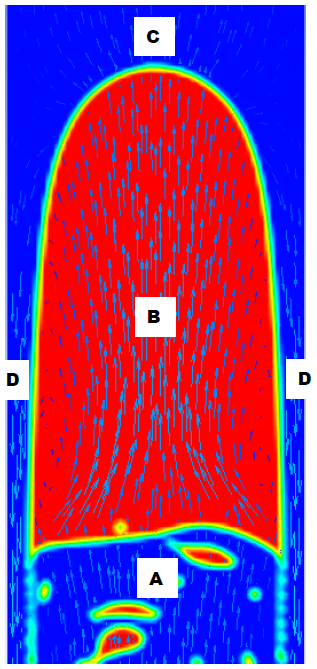
The influence of L/D ratio in air-water two-phase flow development in vertically upward pipes was investigated in the 2D r-z cross-section of the Taylor bubble as shown in Figure 2. Figure 2 is the numerical simulation output of 2D r-z cross-sections of the Taylor bubble and the corresponding velocity field vectors where four main regions are identified. A is a wake region, B is Taylor gas stream, C is the hemispherical or prolate-hemispheroidal nose and D is a falling liquid film region.21
|
Figure 2 r-z cross-sectional view of a Taylor bubble shape in flowing liquid film and corresponding velocity field vectors. Source: Chidamoio et al. |
Effect of the lift gas superficial velocity on the radial profile of the axial velocity along the Taylor bubble and around it
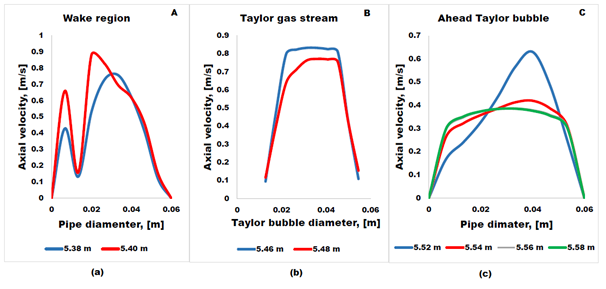
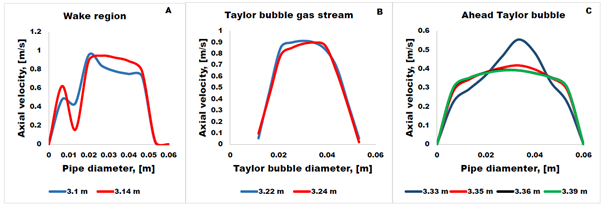
The axial velocity fields were plotted for radial positions at different axial distances in regions A, B and C presented in Figure 2. The corresponding radial component of the axial velocities profiles for L/D ratios of 833.3 and 1666.7 are presented in Figures 3 and 4, respectively.
The output simulation of the of the axial velocity profile in regions A, B and C are presented in Figure 3 for L/D ratio of 833.3 and Figure 4 for L/D ratio of 1666.7. The blue line on (c) represents the radial profile of the axial velocity at Taylor bubble nose le line. In both cases, the liquid inlet superficial velocity was 0.1 m/s and for gas inlet superficial velocity we used 0.5 m/s.
In the wake region, an irregular and indefinite profile of axial velocity can be observed. This might be associated to complex vortices. This trend is observed in all L/D ratio domains as shown in Figures 3 and 4. The axial velocity profile in the Taylor gas stream does not have a well-defined shape while, at Taylor bubble nose, we see the eccentricity distributions of axial velocity and off-centered to the right side of the pipe.
Ahead the Taylor bubble, flattening of the axial velocity profile is observed in all geometry domains. We have found that the nose of the Taylor bubble began to distort, becoming alternately eccentric on one side or another, and leaning over to one side of the tube. This is attributable to the competition between the increase in the gravitational pressure gradient and the imposed initial velocities to drive the fluid (interaction between the gravitational forces and inertial forces). Similar results were obtained by Chidamoio et al.21 on L/D ratio of 166.7
Effect of pipe length on water flow field development in front of the Taylor bubble
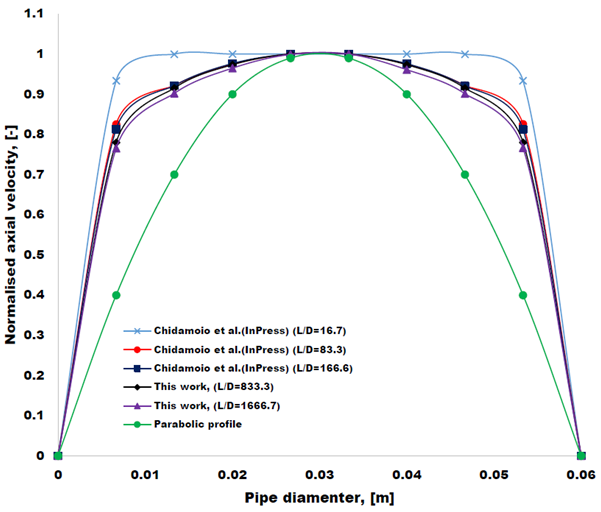
The radial distribution of the axial velocity is normalised by the maximum velocity at the center line of the pipe diameter, Umax. The theoretical parabolic distribution and the results from21 are plotted together with the present numerical solution results. From Figure 5, we see that by increasing the pipe length, the radial profile of the axial velocity tends to approach the parabolic profile L/D ratio of 1666.7 compared to L/D of 833.3. This profile advocates that the axial velocity profile in the liquid film ahead the leading Taylor bubble is influenced by the pipe length. Comparable profiles were observed by Polonsky et al.; Santos et al. and Wang et al.,15,29,30 where they found that the velocity profile is well fitted with one-seventh power-law, despite the fact that they have used fixed pipe length in their investigation. From this result, it can be deduced that the L/D ratio of 1666.7 is not sufficient to achieve the fully-developed flow of the liquid ahead of the leading Taylor bubble.
|
Figure 5 Average axial liquid velocity distributions above the Taylor bubble nose for geometric ratios of 833.3 and 1666.7 and comparison with the results obtained by Chidamoio et al..21 The inlet air superficial velocity is 0.5.0 m/s and water superficial velocity is 0.1 m/s. |
Comparison between numerical solution and analytical solutions
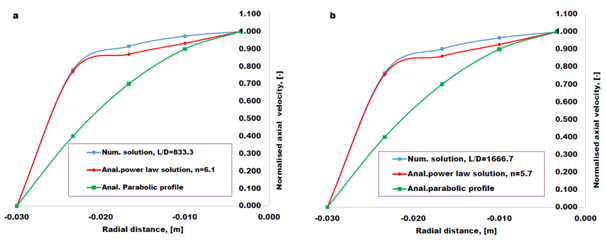
Based on the numerical simulation solutions, we have performed a theoretical analysis by comparing the numerical simulated results with the power law analytical solution represented by Equation 4. Figure 6 shows comparison of the devolved analytical solutions based on theoretical power-law described by Equation 4 using different values of exponent n as indicated in Equation 5.
|
(4) |
It is postulated that the graph of versus r will collapse on to the parabolic solution for higher values of L/D. This extreme limit has not been numerically tested in this manuscript.
The power law of normalised axial velocity profile in the range of the L/D ratios is reasonably represented as:
|
(5) |
|
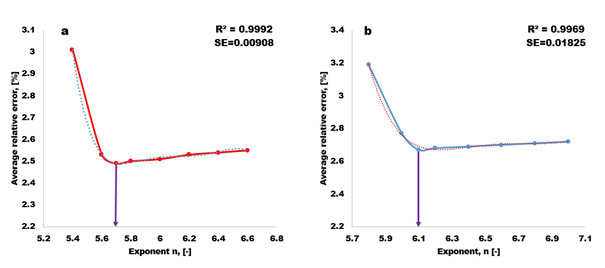
Figure 6 Comparison between present simulations with the theoretical solution (Equation 4) of the axial velocity profile ahead the Taylor bubble nose for L/D=833.3 (a), and L/D=1666.7 (b). |
The best-fit exponents presented in Equation 5 were obtained based on minimum average error analysis between the numerical solution and the theoretical power law solution. The relative error is plotted against the exponent n ranging from 5.3 to 7.1 as shown in Figure 7, where we found the minimum error of 2.49% for n=5.7 in L/D=833.3 and 2.67% for n=6.1 in L/D=1666.7. The correlation coefficient calculated for each mismatch is presented in Figure 7 along with the fitted lines. The fitted lines are functions of 5th order in the range of exponent n and the corresponding expressions are showed in equations (6) for L/D=833.3 and (7) for L/D=1666.7, respectively. In all cases, the correlation coefficients are close to 1 and the standard error is less than 2%. This implies that the two models produce equally good predictions for the curved relationship of the mismatch.
|
(6) |
|
|
(7) |
Conclusion
Based on the analysis of L/D ratio investigated in21 for lower L/D ratios, further investigation on the influence of L/D in air-water two phase slug flow regime development is performed for higher L/D ratios of 833.3 and 1666.7. The eccentricity distributions of axial velocity on leading Taylor bubble stream and on its nose is observed in all geometreis assessed. The power law theoretical equation best match the numerical solutions with missmach error of 2.49% for L/D=833.3 and 2.67% for L/D=1666.7, respectively. A decrease in exponent n as L/D increase is perceived. From this, we have obtanied the exponent n=6.1 for L/D=833.3 and n=5.7 for L/D=1666.7, respectively. Despite a decrease in the exponent as L/D ratio increases, a fully parabolic profile could not be achieved suggesting that further investigation on L/D ratio incorporating other inherent variables which are likely to affect the development of the full parabolic profile may be required.
References
- Brennen CE. Fundamentals of Multiphase Flow. Cambridge University Press. 2005.
- Wan RG, Liu Y, Wang J. A Multiphase Flow Approach to Modeling Sand Production Using Finite Elements. Journal of Canadian Petroleum Technology. 2007;46(4).
- Araújo JDP, Miranda JM, Campos J. Simulation of slug flow systems under laminar regime: Hydrodynamics with individual and a pair of consecutive Taylor bubbles. J Pet Sci Eng. 2013;111:1−14.
- Mayor TS, Ferreira V, Pinto A, et al. Hydrodynamics of gas–liquid slug flow along vertical pipes in turbulent regime–An experimental study. International Journal of Heat and Fluid Flow. 2008;29(4):1039−1053.
- Morgado A, Miranda J, Araújo J, et al. Review on vertical gas–liquid slug flow. International Journal of Multiphase Flow. 2016;85:348−368.
- Saffari H, Moosavi R, Nouri N, et al. Prediction of hydrodynamic entrance length for single and two-phase flow in helical coils, Chemical Engineering and Processing: Process Intensification. 2014;86:9−21.
- Imada FHJ, Saltara F, Balifio JL. Numerical study of the churn-slug transition dynamics in vertical upward air-water flows. Computational Methods in Multiphase Flow VII. 2013;79:101−114.
- Abdulkadir M, Hernandez-Perez V, Abdulkareem L, et al. Characteristics of slug flow in a vertical riser. In: Nigeria Annual International Conference and Exhibition. Society of Petroleum Engineers. 2010.
- Zabaras G. Prediction of Slug Frequency for Gas/Liquid Flows. Society of Petroleum Engineers. 2000.
- Davies R, Taylor G. The mechanics of large bubbles rising through extended liquids and through liquids in tubes. Proceedings of the Royal Society of London A: Mathematical, Physical and Engineering Sciences. 1950;375−390.
- Griffith P, Wallis G. Two-phase slug flow. Journal of Heat Transfer. 1961;83(3):307−318.
- Davidson J, Nicklin D, Wilkes J. Two Phase Flow in Vertical Tubes. Transactions of the Institution of Chemical Engineers. 1962;40:61.
- Collins R, De Moraes F, Davidson J, et al. The motion of a large gas bubble rising through liquid flowing in a tube. J Fluid Mech. 1978;89(3):497−514.
- Kaji R, Azzopardi B, Lucas D. Investigation of flow development of co-current gas–liquid vertical slug flow. International Journal of Multiphase Flow. 2009;35(4):335−348.
- Santos L, Coelho Pinheiro M. Flow around individual Taylor bubbles rising in a vertical column with water: Effect of gas expansion. International Journal of Multiphase Flow. 2014;63:39−51.
- Frooqnia A. Numerical simulation and interpretation of borehole fluid-production measurements, PhD. The University of Texas at Austin. 2014.
- Rosa E, Souza M. Spatial void fraction measurement in an upward gas–liquid flow on the slug regime, Flow Meas Instrum. 2015;46:139−154.
- Mayor T, Pinto A, Campos J. Hydrodynamics of Gas–Liquid Slug Flow along Vertical Pipes in Turbulent Regime: A Simulation Study. Chem Eng Res Des. 2007;85(11):1497−1513.
- Mayor T, Pinto A, Campos J. Vertical slug flow in laminar regime in the liquid and turbulent regime in the bubble wake—Comparison with fully turbulent and fully laminar regimes. Chem Eng Sci. 2008;63(14):3614−3631.
- Xia G, Cui Z, Liu Q, et al. A model for liquid slug length distribution in vertical gas-liquid slug flow. J Hydrodynam B. 2009;21(4):491−498.
- Chidamoio J, Akanji L, Rafati R. Prediction of optimum length to diameter ratio for two-phase fluid flow development in vertical pipes. Advances in Petroleum Exploration and Development.14.
- Fluent A. Fluent 6.3 Documentation. Fluent Inc, Lebanon, NH. 2006.
- Launder B, Spalding D. The numerical computation of turbulent flows. Comput Methods Appl Mech Eng. 1974;3(2).
- Yakhot V, Orszag SA. Renormalization group analysis of turbulence. I. Basic theory. J Sci Comput. 1986;1(1):3−51.
- Hirt CW, Nichols BD. Volume of fluid (VOF) method for the dynamics of free boundaries. J Comput Phys. 1981;39(1):201−225.
- Brackbill JU, Kothe DB, Zemach C. A continuum method for modeling surface tension. J Comput Phys. (1992);100(2):335−354.
- Versteeg HK, Malalasekera W. An introduction to computational fluid dynamics: the finite volume method. Pearson Education. 2007.
- Patankar S, Spalding D. A calculation procedure for heat, mass and momentum transfer in three-dimensional parabolic flows. Int J Heat Mass Transf. 1972;15(10):1787−1806.
- Polonsky S, Shemer L, Barnea D. The relation between the Taylor bubble motion and the velocity field ahead of it. International Journal of Multiphase Flow. 1999;25(6–7):975−975.
- Yan C, Yan C, Sun L, et al. Air–water two-phase flow in a rolling 3 × 3 rod bundle under stagnant condition. Experimental Thermal and Fluid Science. 2014;55:200−209.
