Volume : 1 | Issue : 2
Research
Reservoir properties and sealing potentials of the Akani Oil Field structures, Eastern Niger Delta, Nigeria
RU Ideozu, TC Iheaturu, CU Ugwueze, I Njoku
Department of Geology, University of Port Harcourt, Nigeria
Received: May 02, 2018 | Published: May 15, 2018
Abstract
This research is focused on the reservoir properties and the sealing potentials of the Akani Oil Field structures located in the Coastal Swamp depositional belt of the Niger Delta using well logs and 3D seismic profile. The field has a high level of complexity of fault seal that may have controlled the distribution of hydrocarbon in the field. Average petrophysical properties namely net-to-gross, volume of shale, porosity and permeability were evaluated using the Sequential Gaussian Simulation while the 3D seismic profile was used to generate grid horizons and fault polygons. Results from the petrophysical analyses identified Akani reservoirs 6C-sand and 3C-sand as being very good reservoirs with average porosity of 28.5%, permeability of 2100mD, net-to-gross ratio of 0.5 and volume of clay of 0.4. A total of twenty-three faults where mapped and modelled from the 3D seismic profile. Shale Gouge ratio values were calibrated across the oil field and used to determine the sealing potentials of the faults. A single average time-depth function in conjunction with Root Mean Square (RMS) amplitude map was used to extract information on the bright spots, aerial extent and influence of hydrocarbon fluids on seismic response. Hydrocarbon column height of 266.6ft was found in the Akani reservoir-6C sand and seen to be structurally controlled, which suggested a strong sealing potential. In addition, hydrocarbon column heights of 269.5ft and 333.54ft were found in the Akani reservoir-13C sand with an average thickness of about 600ft. The sealing potential and resistance to flow across fault boundaries depended hugely on the relationship between the bulk formation properties and the architectures of the faults.
Keywords: Reservoir properties, Sealing potentials, Static conditions, Shale gouge ratio, Niger delta
Introduction
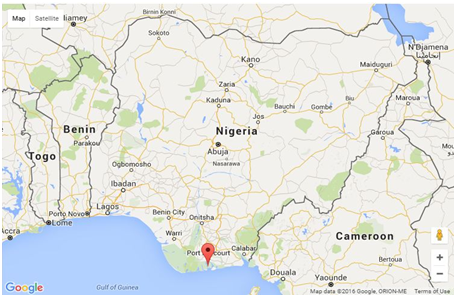
This research examines the effectiveness of static 3D modeling, fault rock properties along the fault planes, how they affect fault sealing and hydrocarbon accumulation in the Agbada Formation delineated in the Akani Field. The Akani Field structure is an elongate footwall trending east-west closure, typically part of the highly faulted Onshore Coastal Swamp, Eastern Niger Delta, Nigeria. The Akani Field is isolated by a major antithetic fault – the Akani Boundary Fault. The field consists of 3 major accumulations spanning 16km. The main hydrocarbon accumulations are between the depths of 6,500ft and 11,200ft subsea. The Niger Delta is regarded as a classical shale tectonics province.1 The instability and constant motion of the shales in response to the weight of the advancing sediment wedge has resulted in the development of different structural styles in different belts of the cretaceous Delta.2 The Delta has thus been subdivided into five zones. Corredor et al.3 identified these structural zones as: (i) An extensional province beneath the continental shelf that is characterized by both basin-ward‐dipping (Roho‐type) and counter‐regional growth normal faults and associated roll-overs and depo-centers. (ii) A mud diapir zone located beneath the upper continental slope, which is characterized by passive, active, and reactive mud diapirs, including shale ridges and massifs, shale overhangs, vertical mud diapirs that form mud volcanoes at the seafloor, and interdiapir depocenters. The inner fold and thrust belt, which is characterized by basin-ward verging thrust faults (typically imbricated) and associated folds, including some detachment folds. (iii) A transitional detachment fold zone beneath the lower continental slope that is characterized by large areas of little or no deformation interspersed with large, broad detachment folds above structurally thickened Akata Formation, and (iv) The outer fold and thrust belt characterized by both basin-ward and hinter‐land‐verging thrust faults and associated folds. The inner and outer fold and thrust belts are most evident in the bathymetric sea‐floor image of the Niger Delta obtained from a dense grid of two‐dimensional seismic reflection profiles where ridges represent the crests of fault‐related folds, and low regions correspond to piggyback basins formed above the back limbs of fault imbricates2.. However, the inner fold and thrust belt extends in an arcuate path across the center of the offshore delta, whereas the outer fold and thrust belt consists of northern and southern sections that define two outboard lobes of the delta.3 These two lobes, and their associated fold belts, are separated by a major rise in the basement topography that corresponds to the northern culmination of the Charcot fracture zone.2 The Akani Field, is believed to be a megastructure with a complexity fault architecture which may impact on the distribution of reservoir properties. Thus, this research seeks to use 3D static modeling to establish a relationship between faulting, hydrocarbon accumulation and the distribution of reservoir properties in the identified reservoir sands. This study is limited to subsurface well correlation, evaluation of petrophysical properties, rock property of faults, shale volume distribution, 2D/3D reservoir modeling and uncertainty reduction by applying a fault juxtaposition map. The Akani Field is situated in the Coastal Swamp Depobelt, Eastern Niger Delta. See Figure 1.
Materials and methods
Materials
The following data provided by an International oil IOC in Nigeria, propriety reasons does not permit mention of the field name and company providing the data:
- Composite well logs of 12-wells (gamma ray, resistivity, and neutron density logs, sonic)
- Well headers
- Well tops
- Checkshot data
- Seismic data in Seg-Y
- Deviation data
- Petrel Software
Methods
- Data quality control checks were carried out on the well log data, well tops and checkshot data, these were afterwards, imported into petrel application software for analysis. The checkshot data was utilized for time to depth conversion (i.e. Milliseconds to feet). A single average time-depth function was used to generate a Root Mean Square (RMS) amplitude map for the surfaces to extract information on sweet spots, aerial extent and influence of hydrocarbon fluid on seismic response.
- Correlate and delineate subsurface horizons.
- Determining the petrophysical properties from the well logs (thickness, ᶲt, vclay, NTG, K, Shale gouge ratio).
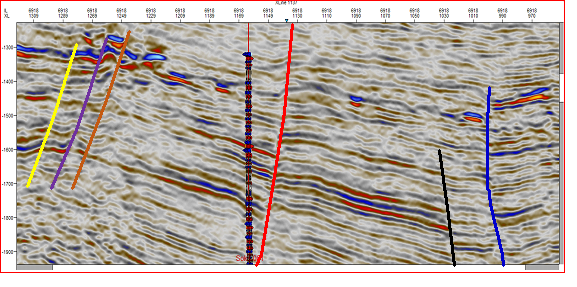
- Seismic picking of the horizons was based on a synthetic process within the limits of seismic resolution and about 23 faults where identified in the seismic section. This was carried out across the seismic lines measured in two-way-time (milliseconds). The key seismic reflectors that correspond to top of reservoir sands 6C and 13C were picked on seismic inline for mapping against corresponding fault lines. Although, a very noisy, chaotic and low amplitude seismic reflection was observed at some point, nevertheless, picking was kept simple and consistent. Furthermore, checkshot data was utilized for the time to depth conversion (i.e. Milliseconds to feet). A single average time-depth function was used after which a Root Mean Square (RMS) amplitude map was generated for the surfaces to extract information on sweet spots, aerial extent and influence of subsurface fluid on seismic response. The bulk reservoir volume was modeled in 3D so that random intersection slices of the field could be taken to study the geology of the field. Data upscaling was carried out using the Sequential Gaussian simulation to distribute the petrophysical properties across the modeled reservoir volume and a juxtaposition map was analyzed in 2D/3D cross section. Values for shale gouge ratio were calibrated and was used to evaluate the sealing ability of the identified faults. The well tops of 6C and 13C were imported into Petrel software and correlated by picking shale markers on gamma ray logs to identify the reservoir and non-reservoir sands. Sand/shale marker adjustments where carefully done to capture thickness of interest from top to bottom. Reservoir porosity was calculated using available porosity logs (density and neutron). A very important approach in analyzing fault behavior and sealing potential is the modeling of faults and creating a fault-plane throw and juxtaposition map at seismic scale.4 This however, introduced some uncertainty due to the limits of seismic resolution, as seismic did not allow the modeling of faults whose throw was smaller than its resolution. Gamma ray log data was however used to correlate lateral and vertical formation signatures (reservoir and non-reservoir) and its relationship across the existing wells. This was used to determine the vertical heterogeneity, facies correlation and Net-to-gross. Stratigraphic correlation was carried out across the field using a consistent combination of well log signatures. Reservoir fluid contents where extrapolated from deep resistivity log signatures in combination with other logs across the wells. Neutron and density logs where used in combination with other logs to calculate the permeability, total and effective porosity of the horizons of interest. These formation bulk properties were necessary, to give an idea of the texture of the grains (grain or matrix supported), effective porosity and shale gouge to establish its effect on sealing. The seal ability and its resistance to cross flow depend on but not limited to the relationship between these bulk properties and the architecture of the faults.
- Fault-seal analysis (sealing capacity, Column heights) - Integration of fault-zone architecture, fault rock properties and pressure regime is necessary for a successful fault seal evaluation.4 A critical technique for analyzing the cross-flow potential of a fault is the strike view or map of the fault plane showing the hanging wall and footwall closures superimposed on the mapped fault surfaces.5 Allan diagrams leverage on this technique to x-ray potential hydrocarbon-migration pathways, leak and sealing areas across a fault. The purpose of this fault-seal analysis is to generate a representative subsurface geologic model of characteristic reservoir sand/shale sequence mapped to the fault of interest to understand the reservoir connectivity under static conditions. In view of this, an attempt was made to build a static model that represents the subsurface reality of the Sand 6C and 13C sands penetrated by the wells. A static geological model of 6C and 13C reservoir tops showing the sediment deposition profiling for the entire Akani Field was built by using relevant downhole data and corresponding interpretations from petrophysical log signatures. A juxtaposition triangle allows simple and quick evaluation of stratigraphic juxtapositions across adjacent sides of a fault plane, for instance when a reservoir sand is juxtaposed against an impermeable clay (non-reservoir) or a permeability differentiated reservoir sand unit (cataclastic) that acts as a seal. This approach was used to x-ray the subsurface stratigraphic mapping on adjacent sides of the faults and identify reservoir properties controlling the sealing potentials of the faults. The volume of clay distribution across the spread was also a very important bulk property element that gave an insight about the prevailing energy conditions that may have occurred during sediment deposition. Ductile and continuous smearing of adjacent high clay bearing formations where also considered in inferring the sealing potential of the faults, but this could not be determined completely due to the unavailability of formation core data. Diverse approaches have been used by different authors to analyze the distribution of fault rocks within a fault damage zone. Shale-Gouge Ratio (SGR) and the clay smear estimation are two of the most frequently used techniques.6 Calculation of formation shale gouge ratio (SGR) across adjacent sides of the faults was calculated and mapped to faults to show the distribution of shale and its sealing potential. Figure 2, represents a cartoon of the Shale Gouge Ratio (SGR) algorithm used. The SGR technique evaluates the percentage of shale derived from the host lithology and mixed with the fault zone. Also, the SGR algorithm estimates the amount of shale from the host strata that has moved past each point in the fault. This is calculated across the modeled fault surfaces with the throw distribution and percentage clay values derived from the well logs. See Figure 3.
- Determining the structural uncertainty of the Akani Field.
- A combination of stochastic and deterministic approach was applied in the data interpretation which generated output values for shale volume, net to gross, effective porosity and permeability.
|
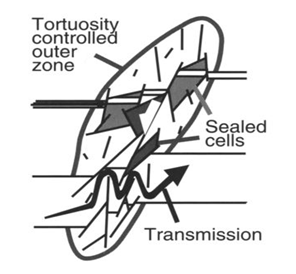
Figure 2 Structural framework of a fault damaged zone.7 |
|
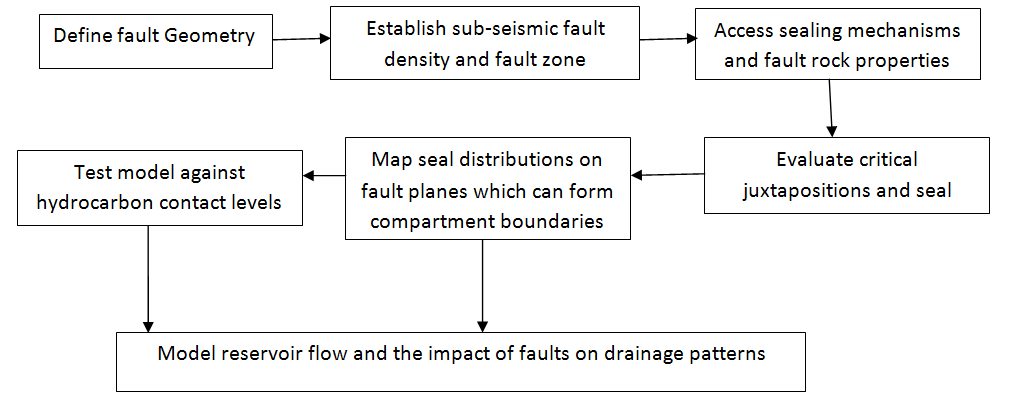
Figure 3 Fault analysis and seal evaluation workflow after Knipe and Jones.7 |
Results
The results of this research are presented in Figures 4 – 22 and Tables 1 and 2.
|
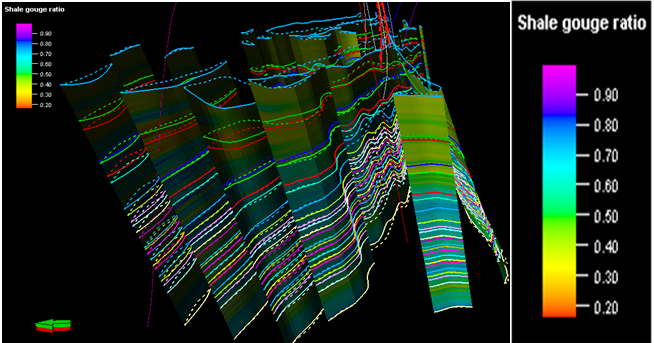
Figure 8 Display of the strike view of the fault model in the study field showing orientation and Shale Gouge Ratio (SGR) calibration |
|
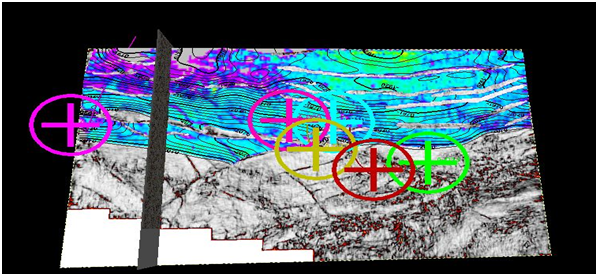
Figure 10 fault Interpreted extract on seismic semblance map showing bright spots and depth profile (Fault Interpreted extract on seismic semblance map showing bright spots and depth profile) |
|
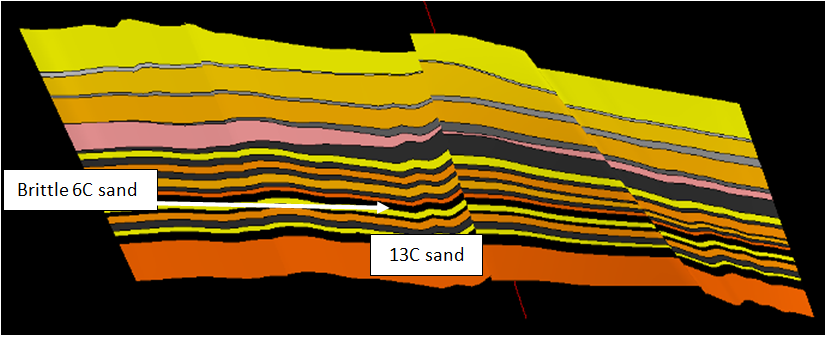
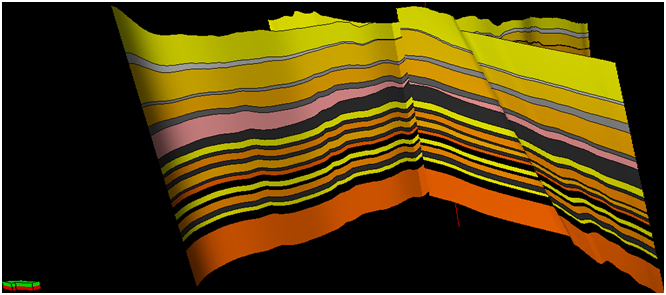
Figure 15 Super-imposition of cross-section A-A1 and B-B1 displaying the effect of stratigraphic juxtapositions on the reservoirs |
|
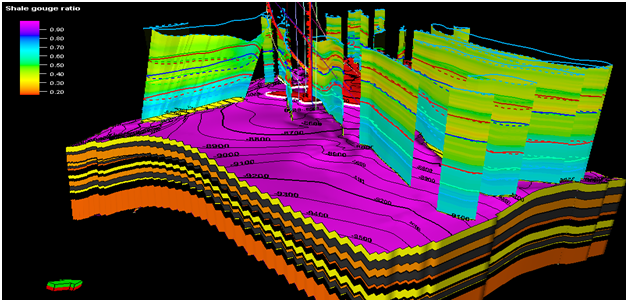
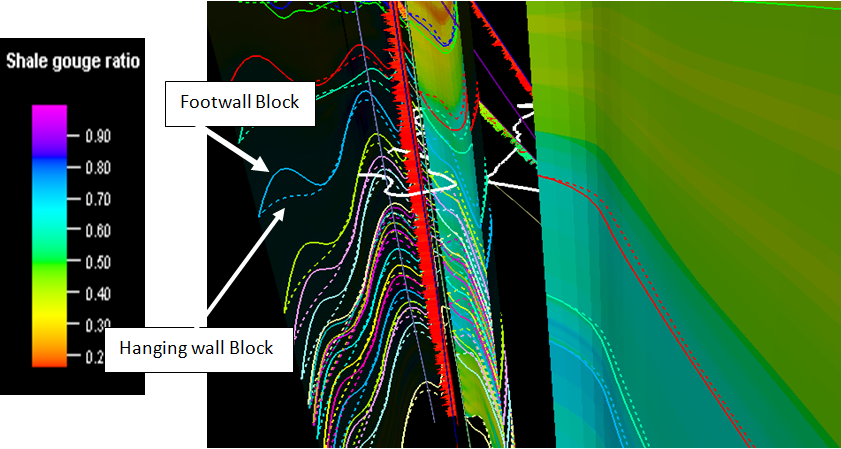
Figure 16 Fault Seal analysis of 6C reservoir showing footwal and hanging wall closures and shale guoge ratio |
|
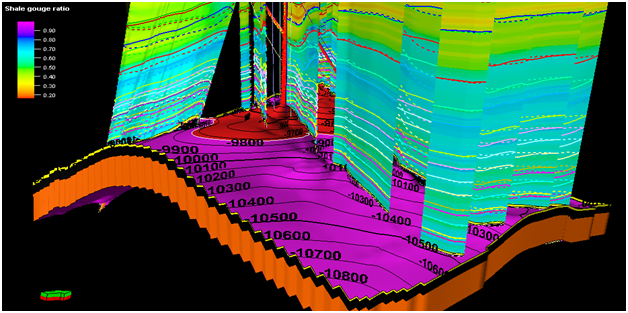
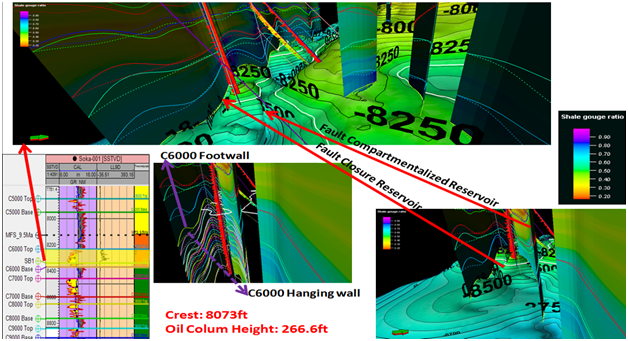
Figure 17 Fault Seal analysis of 6C reservoir showing fault closure, compartmentalization, single crest and hydrocarbon column height of about 266.6ft |
Petrophysical calculations of well 4 |
||||
|---|---|---|---|---|
|
6C sand |
13C sand |
||
Top (ft) |
8227.5 |
9697.5 |
||
Bottom (ft) |
8369 |
10285 |
||
Thickness (ft) |
141.5 |
587.5 |
||
ᶲt |
0.31 |
0.32 |
0.42 |
0.27 |
Average ᶲt |
0.315 |
0.345 |
||
K |
2834.75 |
3020.77 |
4912.69 |
2299.53 |
Average K |
2927.76 |
3606.11 |
||
ᶲeff |
0.26 |
0.11 |
0.28 |
0.17 |
Average ᶲeff |
0.185 |
0.225 |
||
Vsh |
0.1562 |
0.656 |
0.325 |
0.3743 |
Average Vsh |
0.4061 |
0.34965 |
||
NTG |
0.84 |
0.34 |
0.67 |
0.63 |
Average NTG |
0.59 |
0.65 |
||
Table 1 Petrophysical calculations of well 4
Petrophysical calculations of well 1 |
||||
|---|---|---|---|---|
|
6C sand |
13C sand |
||
Top (ft) |
8227 |
9672 |
||
Bottom (ft) |
8367 |
10282 |
||
Thickness (ft) |
140 |
610 |
||
ᶲt |
0.17 |
0.39 |
0.13 |
0.31 |
Average ᶲt |
0.28 |
0.22 |
||
K |
1101.95 |
4330.51 |
749.88 |
2813.94 |
Average K |
2716.23 |
1781.91 |
||
ᶲeff |
0.05 |
0.34 |
0.03 |
0.26 |
Average ᶲeff |
0.195 |
0.145 |
||
Vsh |
71.615 |
11.85 |
79.142 |
15.9525 |
Average Vsh |
41.7325 |
47.54725 |
||
NTG |
0.28 |
0.88 |
0.21 |
0.84 |
Average NTG |
0.58 |
0.525 |
||
Table 2 Petrophysical calculations of well 1
Discussion
Well correlation and stratigraphy
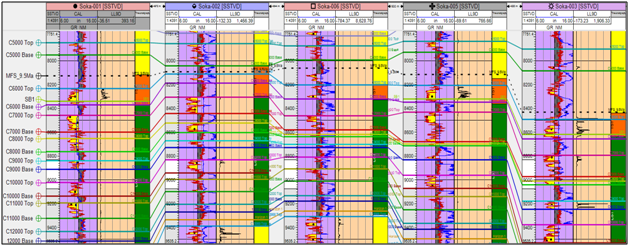
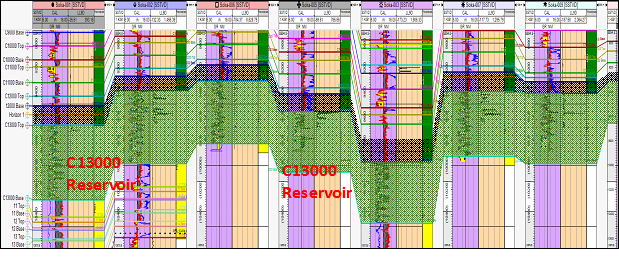
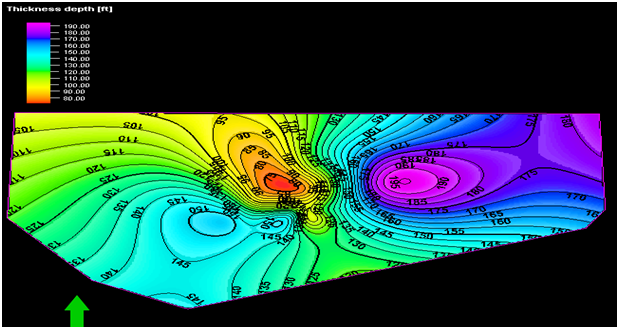
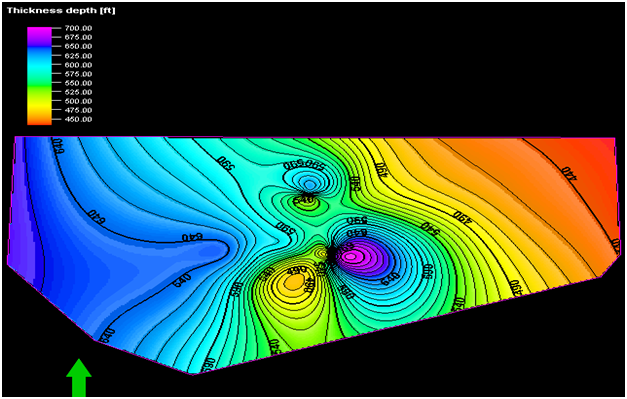
The reservoirs of interest were identified (6C and 13C) have been mapped and correlated across the field (Figures 4 and 5). Reservoir 6C lie within the depths of 8,200ft – 8,400ft with an average thickness of about 140ft while Reservoir 13C is within the depth of 9,600ft – 10,300ft with an average thickness of about 600ft. Figure 6 shows the depth contour map of 6C top to base of sand with a ridge-like deposition pattern and a valley (low sediment thickness) through the middle of the reserveoir top. While, Figure 7 shows the depth contour map of 13C top to base of sand with a gentle sloping plane across the reservoir surface.
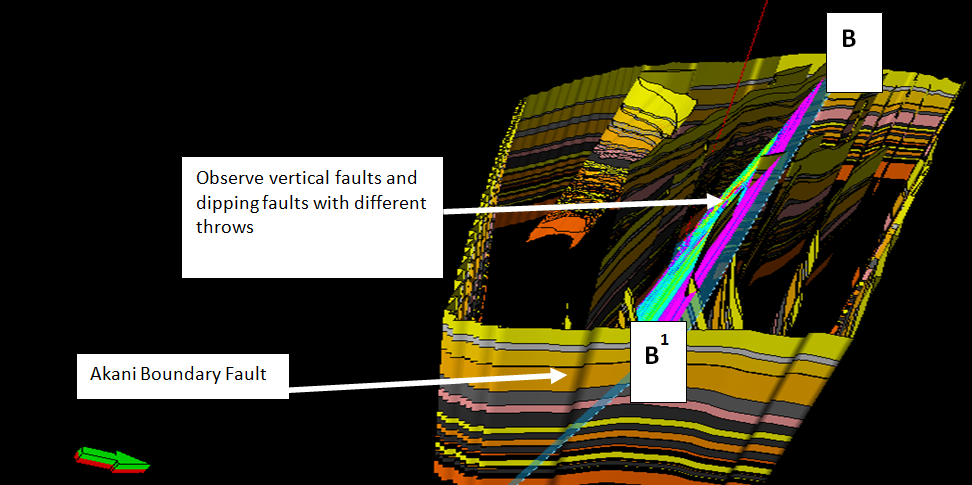
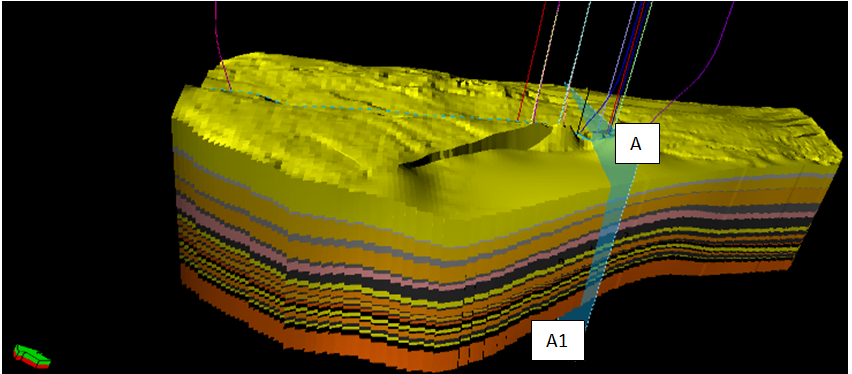
Figure 6 is a depositional profile that shows sediment thickness in the reservoirs may be anticlinal terminating towards the Akani boundary fault (Figure 11). The identified faults are modelled within the limits of seismic resolution, and a total of 23 faults were mapped with various degrees of linkages (See Figures 8 and 11). A 3D model of the field sub-divided into different horizons and covers an aerial extent of about 1.21194 x 109ft2 at latitude N510∘52’ 30” and longitude E566∘ 11’ 57.2” (See Figure 12). Evidence, shows that the faults have juxtaposed reservoirs against dissimilar lithologies (Figure 13) and influence hydrocarbon recovery especially when there is damage in seal or pressure communication, thus a shale gouge ratio (SGR) of 0.1 - 1.0 has been used to evaluate faults within the Akani Field. The Cross Sections B-B1 (Figure 14) shows the most prominent subsection across the length of the 3D modeled field. Cross Sections A-A1 and B-B1 (Figures 13 and 14) have been combined and shows the hanging wall and footwalls have been x-rayed with dotted and continuous lines respectively to visualize the analyze fault juxtapositions (See Figures 8, 15 – 19).
Fault seal analysis
The field is structurally controlled, comprising normal faults which may have influenced the accumulation of reservoir fluids within the field towards the Akani boundary fault. The non-wetting fluids (hydrocarbon) identified from deep resistivity log signatures suggest a major accumulation within the field towards the Akani boundary fault, hence, making it the reservoir of interest. Thus, an attempt has been made based on Shale Gouge Ratio to calibrate (Figures 18 and 19) the faults, fault architecture and the formation vertical heterogeneity to determine the sealing prospects of these faults. The fault zone architecture could possibly be a single fault or more complex than what has been displayed (sand, fine sand and shale sequences) based on horizon stacking pattern and juxtapositions.
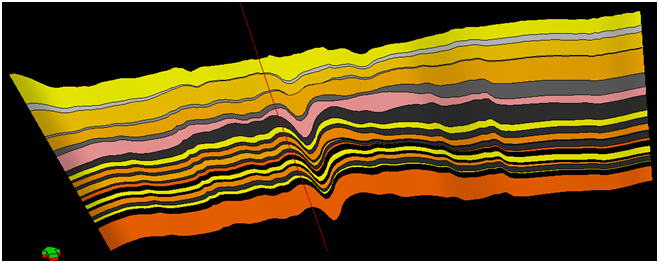
The movement of shales within the Akani Field faults may have smeared up and down along weak surfaces, because of the lithostatic pressure of the conformable succession of compacting sediments. This is evident in the stratigraphic cross section of B-B1 (Figure 14) and suggests a sinking surface, sag or possibility of smearing because of gravity tectonics. The evolution and burial history of the Niger Delta Basin may have had an impact on the deformation process leading to the movement and sagging of theses ductile clays during the time of deposition of sediments. This suggests a combination of stratigraphic juxtapositions and faulting playing a role in influencing the trapping and accumulation of fluids in reservoirs.
It is worthy to note therefore that; the faults and juxtaposed reservoir stratigraphy aided the sealing as observed in reservoir 6C fault seal analysis (Figure 17). The fault seal analysis of 6C reservoir shows a fault closure, single crest and hydrocarbon column height of about 266.6ft. In addition, the reservoir 6C has a moderate to high shale gouge ratio (range 0.5 - 0.8) and an average Vclay of about 0.4%. Yielding et al.6, (1997), in their classic work on quantitative fault seal prediction, have maintained that a shale gouge of 20% should be a threshold above which continuous mixing can offer the prospect of an intact seal. Pressure difference on adjacent sides of the faults where however, not evaluated to account for the column heights, therefore, we rely on the hydrodynamic findings made by Adabanija and Ekpah.8 The sealing potential of the 6C top to bottom of sand is laterally juxtaposed against an impermeable shale unit and the sealing capacity of the identified fault is only as strong as its weakest points (Figures 13 – 14). This reservoir could also be described as having pinched out against an impermeable formation or even compartmentalized. The fault sealing ability based on upscaled Shale Gouge Ratio (0.5 – 0.8), may have occurred irrespective of the possibility of communication along the waterleg of the adjacent sand. Furthermore, the reservoir as identified is hydrocarbon bearing (non-wetting) based on resistivity log signatures. Considering the type of deformation that may have occurred within the formation, it is observed that clay smearing may be the most dominant deformation band and the possibility of the ductile clay to smear past the brittle 6C reservoir sand is obvious (Figures 13 and 15). The calibration of the formation cross flow properties near the damage zones using cores calibrated to the formation permeability and pressure differentials would further reduce the uncertainties in this study. In few other areas there seem to be dormant joints or deformation bands that have had little or no movement on either side. These joints irrespective of displacement have shale gouge that has a value at every point. Thus. areas of possible weakness have been made visible through the SGR calibration. The main accumulations have occurred in the central part of the field. Recent studies by Vrolijk et al9, have shown that “reservoir leak and seal could be used in cross-fault flow studies especially, if reservoirs create fluid potential differences which could easily result to flow”. The 13C reservoir has an average depth of about 10,000ft and an average thickness of about 600ft. In this reservoir it is evident that it has a massive bed with relatively low vertical heterogeneity, hence, suggesting prolonged sedimentation (Figure 14). Based on resistivity log signatures (Figures 4 and 5), the 13C sand is believed to retain good accumulation of non-wetting fluid (hydrocarbon) irrespective of the reservoir architecture. The overlying shale thickness and moderate to high Shale Gouge Ratio (0.5 - 0.8) suggest that clay smearing during fault displacement may have played its role in the sealing potential of the reservoir over geologic time. Stratigraphic pattern within this reservoir unit suggest a sand to sand juxtaposition (reservoir against reservoir). This however could lead to capillary and intra-reservoir fault sealing, hence, sealing capacity of the 13C sand may not be wholly fault dependent but rather stratigraphic in nature. The 13C reservoir has a hydrocarbon column height of 469.54ft and 533.54ft and the cross-fault flow potential within this reservoir could be controlled by the bulk property distribution across the massive bed at a rate-controlled Darcy’s flow if further analyzed. Formation sealing may have also been influenced by formation geo-history (depth, burial, pressure and age) which is better analyzed in terms of risk and uncertainties
Reservoir petrophysics
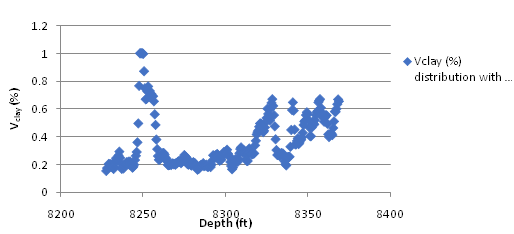
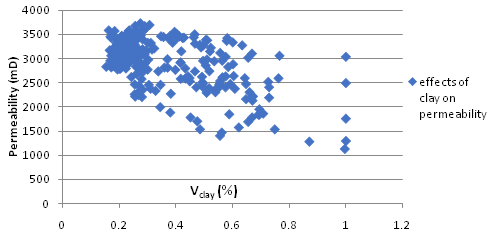
The reservoirs in the Akani Field have been produced over the years. This field has already been drilled to different depths. With a combination of diverse petrophysical logs and its correlation, the two identifiable reservoir sands shows that, 6C and 13C reservoirs have very good to excellent porosity and permeability based on calibrations in Tables 1 and 2. The excellent porosity and permeability of the field can be confirmed from the porosity-permeability cross plot of Figures 20 and 21. Bulk property plots in the field have equally shown that there seem to be a significant distribution of clay with depth that could reflect energy regimes in deposition. Thus, areas of low clay content seem to be more permeable while areas of high clay content seem to have lower permeability.
Conclusion
The complexity in sealing faults, fault architecture and the distribution of hydrocarbon shows clearly the problems in the Akani Field. Faults Identified are majorly normal growth and anthetheitc faults which may have had oblique movement. These faults have some minor linkages, extending into a noisy environment as seen in the seismic section, The Akani Field has shown that shale gouge is among the family of fault properties that can deflect and resist fluid flow. Identification of fault juxtapositions with respect to deformation styles in cross-sections A-A1, B-B1 and superimposed together have shown the effect of fault juxtapositions in the field and may possibly control the distribution of hydrocarbon column heights in the identified reservoirs. This research has demonstrated the effectiveness of static reservoir modeling in analyzing the complexity of faults and sealing ability in the occurrence of hydrocarbon and bulk property distribution within the Akani Field and has aided in predicting geo-historic events that may have occurred over time and has provided a framework in reducing the uncertainty in the fault complexity of the Akani Field.
References
- Wu S, Bally AW. Slope Tectonics-Comparisons and Contrasts of Structural Styles of Salt and Shale Tectonics of the Northern Gulf of Mexico with Shale Tectonics of Offshore Nigeria in Gulf of Guinea. Atl Rifts Cont Margins. 2000:151–172.
- Aminu MB, Olorunniwo MO. Seismic paleo-geomorphic system of the extensional province of the Niger Delta: an example of the Okari field. In: Tectonics-Recent Advances. InTech; 2012.
- Corredor F, Shaw JH, Bilotti F. Structural styles in the deep-water fold and thrust belts of the Niger Delta. Aapg Bull. 2005;89(6):753–780.
- Cerveny K, Davies R, Dudley G, et al. Reducing uncertainty with fault-seal analysis. Oilfield Rev. 2004;16(4):2005.
- Allan US. Model for hydrocarbon migration and entrapment within faulted structures. AAPG Bull. 1989;73(7):803–811.
- Yielding G, Freeman B, Needham DT. Quantitative fault seal prediction. AAPG Bull. 1997;81(6):897–917.
- Knipe RJ, Jones G, Fisher QJ. Faulting, fault sealing and fluid flow in hydrocarbon reservoirs: an introduction. Geol Soc Lond Spec Publ. 1998;147(1):vii–xxi.
- Adabanija MA, Ekpah II. Pressure Regime and Hydrodynamic Study of Niger Delta Coastal Swamp: Implication for Hydrocarbon Recovery and Production. In: International Conference & Exhibition. 2014.
- Vrolijk PJ, Urai JL, Kettermann M. Clay smear: Review of mechanisms and applications. J Struct Geol. 2016;86:95–152.
