Volume : 1 | Issue : 1
Research
Raman spectroscopy: an analytical tool for evaluating organic matter
Seyedalireza Khatibi,1 Mehdi Ostadhassan,1 Azadeh Aghajanpour2
1University of North Dakota, Petroleum Engineering Department, Grand Forks, ND, USA
2Curtin University, Department of Petroleum Engineering, Miri, Sarawak, Malaysia
Received: January 09, 2018 | Published:February 22, 2018
Abstract
With the increase in production from shale oil and shale gas in North America during the last decade, many studies have been conducted in order to improve our knowledge from organic rich shale plays. Kerogen as one of their main constituents, is a complex macromolecule which generates hydrocarbons under adequate pressure and temperature. However, kerogen is still not fully known in terms of geochemistry and geomechanics. In addition, complexity of unconventional shale plays has led to employment new methods and analytical equipment for characterizing organic matter. In this study, samples from the Bakken Formation are collected and analyzed for thermal maturity and geochemical characteristics by Vitrinite reflectance (%VRo) and Rock-Eval (RE) pyrolysis. Then, Raman spectroscopy was performed on the samples as an analytical tool to provide us with deeper insight about molecular structure. To do so, organic matter properties in terms of thermal maturity were correlated with Raman signals. Furthermore, mechanical properties of organic matter that was acquired with PeakForce Tapping mode in atomic force microscopy (AFM) in-situ, was related to its Raman responses. Results showed a very good correlation between Raman signals and geochemical and geomechanical properties of organic matter reflecting molecular characteristics of this component of shale plays.
Keywords: Organic matter, Rock-Eval, Vitrinite reflectance, Raman spectroscopy
Introduction
After the commercial boom of unconventional reservoirs in North America during the past decade, exploration of unconventional shale reservoirs has increased significantly.1 Shale reservoirs with moveable hydrocarbons are often characterized by high quantities of organic matter, which require stimulation methods to exploit the hydrocarbons.2-5 Recent advancements in geomechanical operations such as hydraulic fracturing has been a breakthrough which enables operators to tap resources formerly considered uneconomical.
Many experimental or theoretical studies on the mechanical properties of shale reservoirs has been performed which is due to the dependence of successful field operations on mechanical properties.1,6-9 However, these reservoirs are highly heterogeneous and comprised of variety of components such as: clays, various carbonate and clastic minerals and high content of organic matter.10 Despite such attempts during the last decade, mechanical properties of one of the main constituents of a shale reservoir, kerogen or organic matter, is not thoroughly understood. Studies have shown, the presence of organic matter has a non-negligible effect on hydraulic fracturing operations, since kerogen is not as stiff as other non-organic minerals.11-13
Generally, conventional geomechanical testing such as uniaxial and triaxial compressive strength, are performed on inch-sized cores in the lab.4,5,14-16 While, organic matter is dispersed within the matrix and needs high-resolution equipment to perform the test on the pinpointed location of this material.7,17 Moreover, understanding organic matter properties in terms of maturity and production potential are crucial for initial assessment of unconventional plays. This is important since the amount of hydrocarbon that can be generated is a function of organic matter type and content in the formation along with the depth of burial. All these variations make understanding organic matter more challenging from both molecular and mechanical point of view. Therefore, these complexities of shale plays has made it necessary to acquire new analytical methods for both better reservoir characterization and reserve assessment.
Raman spectroscopy evaluates molecular vibrations and structural order of any material understudies. Thus, any changes in the structure of molecules can be detected with the high spatial resolution of Raman spectroscopy.18 Different researchers have used Raman spectroscopy for structural characterization of carbonaceous materials and maturity of organic matter in coals.19,20 Correlation between Raman signals and maturity was initially described by Kelemen and Fang (2001) for kerogen in coals. Raman spectroscopy was also used by Tuschel (2013) in detecting the contribution of various minerals in mudrocks. Other researchers have also successfully used Raman spectroscopy for thermal maturity evaluation of organic matter.4,5,23-25 Structural evolution of organic matter during thermal maturation (increase in aromaticity and reduction in aliphatic and heteroatoms content) can be reflected on Raman signals notably.26
In this study, a few samples from the organic rich members of the Bakken Formation were selected that are varying in depths and thermal maturity levels. We focused to better understand organic matter properties by acquiring Raman signals from the organic matter only and correlating with geochemical and mechanical properties collected from Rock-Eval pyrolysis, %VR and PeakForce AFM.
Samples and measurements
Upper and lower members of the Bakken Formation are organic rich shales, and middle member is a mixture of carbonates and clastics. The formation was deposited during the Late Devonian and Early Mississippian Periods, where upper and lower members became the source and middle the reservoir. The formation which is an elliptically shaped depression is located in the Williston Basin, spread in North Dakota and Montana in the USA and extends into parts of Canada.4,5 Six samples varying in depth and maturities were selected from different wells drilled in the Bakken Formation. In the following table (Table 1), various measurements which were performed on the samples are summarized. It should be noted that samples are mainly type II kerogen and selected from the upper and lower members only.
Well |
Sample depth (ft) |
TOC (wt%) |
VRo (%) |
Tmax (˚C) |
S1 |
S2 |
|---|---|---|---|---|---|---|
1 |
5438 |
24.71 |
0.39 |
419 |
8 |
128.70 |
2 |
8326 |
16.27 |
0.55 |
428 |
8.3 |
90.71 |
3 |
9886 |
15.76 |
0.57 |
432 |
9.27 |
83.72 |
4 |
10555 |
13.26 |
0.85 |
449 |
0.30 |
33 |
5 |
10725.5 |
9.04 |
0.95 |
450 |
6.15 |
13.96 |
6 |
11199 |
16.36 |
0.93 |
452 |
0.70 |
28 |
Table 1 Properties of six samples used in this study.
Vitrinite maturity and Rock-Eval Pyrolysis measurements 27-30 were carried out on the samples (Table 1) that reflects thermal maturity and potential of the organic matter as a source rock.
Raman scattering reflects the molecular vibrations and symmetries of chemical bonds.31,32 By illuminating a sample with a monochromatic light source, energy is exchanged between the light beam and molecule (depending on the molecular vibration frequency) which leads to a Raman shift.33-35 Considering the response from organic matter, two major peaks known as G and D bands are detectable in Raman spectrum.22,36 The G band refers to graphite with the origin of inplane E2g2 vibrational modes of the carbon atoms in aromatic ring structures4,5,37 while the D band originates from a disorder in the atoms as a result of the Raman-active A1g symmetry associated with lattice defects and discontinuities of the sp2 carbon network.4,5,37
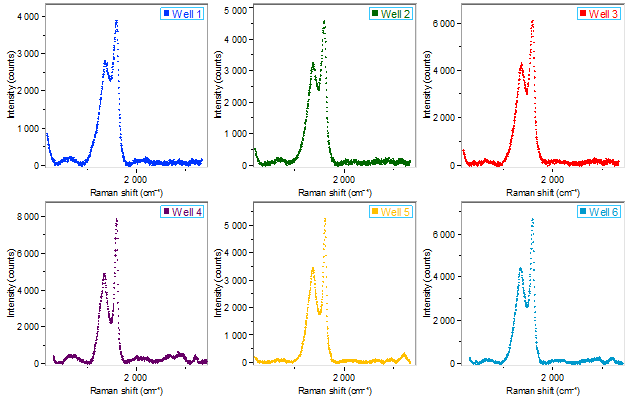
By acquiring spectrum from at least five spots on the surface of each sample focused on the organic matter that is detected under optical microscope, an average final spectrum were obtained as shown in Figure 1 due to presence of hydrogen, high sulfur content and solid bitumen, background noise might also interfere with signals.4,5,38 Table 2 shows the Raman shift of major bands in Raman spectrum for each sample quantitatively.
|
Figure 1 Representative spectra for all samples in this study after background fluorescence removal. D and G bands normally appear around 1350 cm-1 and 1600 cm-1, respectively. |
In a separate study, we also acquired nanomechanical properties of the organic matter with PeakForce Tapping mode of AFM (mark of Bruker), Quantitative Nano-mechanical Mapping (QNM) to acquire the continuous map of elastic modulus of organic matter on each sample in-situ. PeakForce QNM can detect mechanical characteristics of each component separately at nanoscale without altering in-situ conditions which is a major achievement in quantifying mechanical properties of various type of materials. The details of this study is discussed by.7 Table 3 shows measured Young’s modulus, and Table 4 is the mineralogical composition for two of the samples.
Well |
D (cm-1) |
G (cm-1) |
G-D (cm-1) |
|---|---|---|---|
1 |
1367 |
1585 |
218 |
2 |
1367 |
1587 |
220 |
3 |
1361 |
1588.5 |
227.5 |
4 |
1351 |
1595 |
230 |
5 |
1357.5 |
1600.29 |
242.79 |
6 |
1354 |
1591 |
237 |
Table 2 Band position of Raman spectrum for each sample. As seen, bands position change due to structural changes.
Well |
E (GPa) |
|---|---|
1 |
2.5 |
2 |
4 |
3 |
4.1 |
4 |
4.2 |
5 |
10 |
6 |
5.02 |
Table 3 Measured Young’s modulus for in-situ kerogens in this study.
Component |
Well 3 |
Well 5 |
|---|---|---|
Alginite |
0.4 |
0.18 |
Solid Bitumen |
2 |
3 |
Bitumen Lamellae/Staining |
3 |
0.32 |
Granular Bitumen |
0.1 |
0.1 |
Bituminite |
5 |
13 |
Granular Inertinite |
3 |
0.1 |
Clays/Silt |
55 |
50 |
Calcareous Matrix |
5 |
5 |
Siliceous Matrix |
20 |
25 |
Pyrite |
6.5 |
3.3 |
Table 4 Percentage of each component based on visual kerogen assessment.
Results and discussion
Systematic changes in band position, band separation, band full width at half maximum height for carbonaceous materials as a function of thermal maturity has been studied and well documented.4,5,21,39,40 Shifts in position of major bands (shift in the D band towards lower wavelength and very slight shift in G band towards higher wavelength) are attributed to the increase of larger aromatic clusters and better ordered-structure kerogen.4,5,38,41 Figure 2(a) exhibits a correlation between band separations versus thermal maturity for samples in this study obtained by %VR and Tmax (from Rock-Eval Pyrolysis). It can be seen as both Tmax and %VR increases, G-D band separation also increases with a very good correlation, Figure 2.
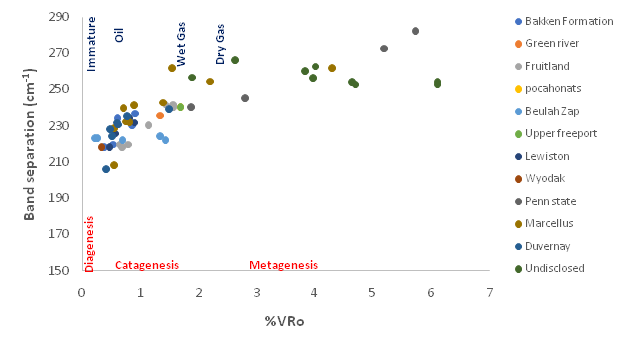
Figure 3 shows maturity versus band separation for 12 different data sets including samples from this study. As seen, band separation variation, in addition to maturity can also detect the window and the type of hydrocarbon that organic matter can produce.
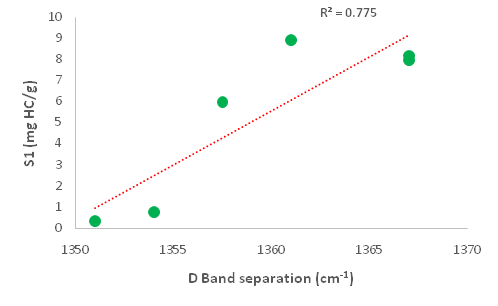
During maturation, the heteroatom-rich organic precursors lose many of their oxygenated and hydrogenated chemical groups43,44 and the number of attachments separating from aromatic carbons increase.45 In Raman spectroscopy, the D band refers to a disorder in the atoms, which results from the Raman-active A1g symmetry associated with in-plane lattice defects and discontinuities of the sp2 carbon network-like heteroatoms.4,5,37 Therefore, the D band from Raman spectroscopy can be used as a measure of the attachments that are separated from organic matter concurrently with hydrocarbon generation. This process is represented by the S1 parameter in Rock-Eval. The correlation between S1 and D band is shown in Figure 4.
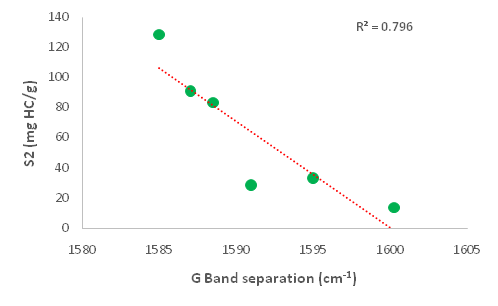
The origin of the G band in Raman spectroscopy as mentioned before is due to the in-plane E2g2 vibrational modes of the carbon atoms in aromatic ring structures.37,46,47 An abundance of aromatic structures means less potential to produce hydrocarbons. Thus, the S2 parameter from Rock-Eval can be correlated to the G band, Figure 5.
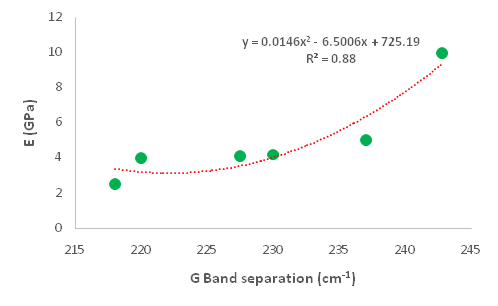
Studies have shown, in immature source rocks the organic matter appears to surround other minerals, becoming a load-bearing part of the rock framework.4,5,48,49 However, by increasing the maturity, kerogen becomes more isolated whereas the grains are more in contact with each other49,50 and records increase in its Young’s modulus. By comparing maturity level of the samples in this study with the Young’s modulus values from PeakForce AFM, a general increasing trend can be observed. Hence, considering the correlation between maturity and band separation (Figure 3), as well as maturity and Young’s modulus, a nonlinear correlation can be established between Young’s modulus and band separation as displayed in Figure 6. This nonlinear relation is also in accordance with nonlinear relation in Figure 3.4,5
|
Figure 6 Young's modulus of organic matter acquired from Peakforce AFM vs. band separation from Raman spectroscopy. |
The proposed method shows the high potential of Raman spectroscopy for acquiring organic matter properties from that reflects its molecular structure represented by Raman signals. Raman spectroscopy was able to detect both geochemical and mechanical alterations of organic matter in a very fast laboratory procedure, also helped us to avoid sample preparation steps that are required for %VRo and PeakForce AFM analysis. This can be a major cost and time saver to get accurate results. However, this method requires further investigations and elaboration with additional data that will be published in the future.
Conclusion
In this study, samples were taken from six wells in the Bakken Formation, Williston Basin. Rock-Eval, vitrinite reflectance, Raman spectroscopy and PeakForce AFM measurements were performed on the samples. In the next step, potential of Raman spectroscopy in geochemical and geomechanical evaluation of organic matter was shown. Based on this study, following items can be concluded:
- Band separation of Raman major band signals can be used as maturity indicator.
- S1 from Rock-Eval was very well correlated with D band in Raman signal as an indicator of disorders in structure of organic matter molecule.
- S2 from Rock-Eval also were correlated with G band in Raman signal as indicator of aromaticity of organic matter molecule.
- Considering the correlations between maturity and band separation, and also maturity and Young’s modulus led to us to establish a relationship between band separation and Young’s modulus of organic matter.
Acknowledgment
The authors wish to thank Dr. Thomas Gentzis and Dr. Humberto Carvajal-Ortiz from Core Laboratories in Houston, TX, for providing us with geochemistry data and fruitful discussions, also, Mr. David Tuschel from Horiba Scientific for the Raman spectroscopy results. We'd like to also thank, North Dakota Geological Survey, Core Library, for giving us access to the Bakken core samples, particularly Jeffrey Bader, state geologist and director as well as Kent Hollands, lab technician. We'd also like to express our appreciation to anonymous reviewers for constructive comments which highly improved the quality of the manuscript.
References
- Abarghani, A., Ostadhassan, M., Gentzis, T., Carvajal-Ortiz, H., & Bubach, B., 2018. Organofacies study of the Bakken source rock in North Dakota, USA, based on organic petrology and geochemistry. International Journal of Coal Geology.
- Aghajanpour, A., Fallahzadeh, S.H., Khatibi, S., Hossain, M.M., Kadkhodaie, A., 2017. Full waveform acoustic data as an aid in reducing uncertainty of mud window design in the absence of leak-off test. Journal of Natural Gas Science and Engineering 45, 786-796.
- Alexeyev, A., Ostadhassan, M., Mohammed, R.A., Bubach, B., Khatibi, S., Li, C., Kong, L., 2017. Well Log Based Geomechanical and Petrophysical Analysis of the Bakken Formation.
- Aoudia, K., Miskimins, J.L., Harris, N.B., Mnich, C.A., 2010. Statistical analysis of the effects of mineralogy on rock mechanical properties of the Woodford Shale and the associated impacts for hydraulic fracture treatment design, 44th US Rock Mechanics Symposium and 5th US-Canada Rock Mechanics Symposium. American Rock Mechanics Association.
- Arshadi, M., Zolfaghari, A., Piri, M., Al-Muntasheri, G.A. and Sayed, M., 2017. The effect of deformation on two-phase flow through proppant-packed fractured shale samples: A micro-scale experimental investigation. Advances in water resources 105, 108-131.
- Behar, F., Beaumont, V., Penteado, H.D.B., 2001. Rock-Eval 6 technology: performances and developments. Oil & Gas Science and Technology 56, 111-134.
- Beyssac, O., Goffé, B., Chopin, C., Rouzaud, J., 2002. Raman spectra of carbonaceous material in metasediments: a new geothermometer. Journal of metamorphic Geology 20, 859-871.
- Beyssac, O., Goffé, B., Petitet, J.-P., Froigneux, E., Moreau, M., Rouzaud, J.-N., 2003. On the characterization of disordered and heterogeneous carbonaceous materials by Raman spectroscopy. Spectrochimica Acta Part A: Molecular and Biomolecular Spectroscopy 59, 2267-2276.
- Cesare, B. and Maineri, C., 1999. Fluid-present anatexis of metapelites at El Joyazo (SE Spain): constraints from Raman spectroscopy of graphite. Contributions to Mineralogy and Petrology 135, 41-52.
- Cheshire, S., Craddock, P.R., Xu, G., Sauerer, B., Pomerantz, A.E., McCormick, D., and Abdallah, W., 2017. Assessing thermal maturity beyond the reaches of vitrinite reflectance and Rock-Eval pyrolysis: A case study from the Silurian Qusaiba formation. International Journal of Coal Geology 180, 29-45.
- Dietrich, A.B., 2015. The impact of organic matter on geomechanical properties and elastic anisotropy in the Vaca Muerta Shale. Colorado School of Mines. Arthur Lakes Library.
- Espitalie, J., Deroo, G., and Marquis, F., 1985. Rock-Eval pyrolysis and its applications. Revue De L Institut Francais Du Petrole 40, 563-579.
- Ferralis, N., Matys, E.D., Knoll, A.H., Hallmann, C., and Summons, R.E., 2016. Rapid, direct and non-destructive assessment of fossil organic matter via microRaman spectroscopy. Carbon 108, 440-449.
- Ferrari, A.C.and Robertson, J., 2000. Interpretation of Raman spectra of disordered and amorphous carbon. Physical review B 61, 14095.
- Han, Y., Al-Muntasheri, G., Katherine, L.H. and Abousleiman, Y.N., 2016, June. Tensile mechanical behavior of kerogen and its potential implication to fracture opening in kerogen-rich shales (KRS). In 50th US rock mechanics/geomechanics symposium. American Rock Mechanics Association.
- Kelemen, S., Afeworki, M., Gorbaty, M., Sansone, M., Kwiatek, P., Walters, C., Freund, H., Siskin, M., Bence, A., Curry, D., 2007. Direct characterization of kerogen by X-ray and solid-state 13C nuclear magnetic resonance methods. Energy & Fuels 21, 1548-1561.
- Kelemen, S., Fang, H., 2001. Maturity trends in Raman spectra from kerogen and coal. Energy & fuels 15, 653-658.
- Keown, D.M., Li, X., Hayashi, J.-i., Li, C.-Z., 2007. Characterization of the structural features of char from the pyrolysis of cane trash using Fourier Transform− Raman spectroscopy. Energy & fuels 21, 1816-1821.
- Khatibi, S., Aghajanpour, A., Ostadhassan, M. and Farzay, O., 2018. Evaluating Single-Parameter parabolic failure criterion in wellbore stability analysis. Journal of Natural Gas Science and Engineering 50, 166-180.
- Khatibi, S., Ostadhassan, M., Tuschel, D., Gentzis, T., Bubach, B. and Carvajal-Ortiz, H., 2018. Raman spectroscopy to study thermal maturity and elastic modulus of kerogen. International Journal of Coal Geology 185, 103-118.
- Kivi, I.R., Ameri, M.J. and Ghassemi, A., 2015. Chemoporoelastic characterization of Ghom shale. Journal of Petroleum Science and Engineering 127, 115-123.
- Kivi, I.R., Zare-Reisabadi, M., Saemi, M. and Zamani, Z., 2017. An intelligent approach to brittleness index estimation in gas shale reservoirs: A case study from a western Iranian basin. Journal of Natural Gas Science and Engineering 44, 177-190.
- Kumar, V., Sondergeld, C.H., and Rai, C.S., 2012. Nano to macro mechanical characterization of shale, SPE Annual Technical Conference and Exhibition. Society of Petroleum Engineers.
- Lahfid, A., Beyssac, O., Deville, E., Negro, F., Chopin, C., and Goffé, B., 2010. Evolution of the Raman spectrum of carbonaceous material in low‐grade metasediments of the Glarus Alps (Switzerland). Terra Nova 22, 354-360.
- Li, C., Ostadhassan, M., and Kong, L., 2017. Nanochemo-mechanical characterization of organic shale through AFM and EDS, SEG Technical Program Expanded Abstracts 2017. Society of Exploration Geophysicists, pp. 3837-3840.
- Liu, K. and Ostadhassan, M., 2017. Microstructural and geomechanical analysis of Bakken shale at nanoscale. Journal of Petroleum science and Engineering 153, 133-144.
- Liu, K., Ostadhassan, M. and Bubach, B., 2016. Applications of nano-indentation methods to estimate nanoscale mechanical properties of shale reservoir rocks. Journal of Natural Gas Science and Engineering 35, 1310-1319.
- Lünsdorf, N.K., 2016. Raman spectroscopy of dispersed vitrinite—Methodical aspects and correlation with reflectance. International Journal of Coal Geology 153, 75-86.
- Marshall, C.P., Edwards, H.G., and Jehlicka, J., 2010. Understanding the application of Raman spectroscopy to the detection of traces of life. Astrobiology 10, 229-243.
- Mighani, S., Taneja, S., Sondergeld, C.H. and Rai, C.S., 2015, November. Nanoindentation creep measurements on shale. In 49th US Rock Mechanics/Geomechanics Symposium. American Rock Mechanics Association.
- Mighani, S., Lockner, D.A., Kilgore, B.D., Sheibani, F. and Evans, B., 2018, January. Interaction Between Hydraulic Fracture and a Preexisting Fracture under Triaxial Stress Conditions. In SPE Hydraulic Fracturing Technology Conference and Exhibition. Society of Petroleum Engineers.
- Mumm, A.S. and İnan, S., 2016. Microscale organic maturity determination of graptolites using Raman spectroscopy. International Journal of Coal Geology 162, 96-107.
- Oberlin, A., Boulmier, J., and Villey, M., 1980. Electron microscopic study of kerogen microtexture. Selected criteria for determining the evolution path and evolution stage of kerogen. Kerogen: Insoluble organic matter from sedimentary rocks: Paris, Editions Technip, 191-241.
- Peters, K., 1986. Guidelines for evaluating petroleum source rock using programmed pyrolysis. AAPG bulletin 70, 318-329.
- Quirico, E., Rouzaud, J.-N., Bonal, L., Montagnac, G., 2005. Maturation grade of coals as revealed by Raman spectroscopy: Progress and problems. Spectrochimica Acta Part A: Molecular and Biomolecular Spectroscopy 61, 2368-2377.
- Reich, S. and Thomsen, C., 2004. Raman spectroscopy of graphite. Philosophical Transactions of the Royal Society of London A: Mathematical, Physical and Engineering Sciences 362, 2271-2288.
- Rouzaud, J., Oberlin, A., 1989. Structure, microtexture, and optical properties of anthracene and saccharose-based carbons. Carbon 27, 517-529.
- Sauerer, B., Craddock, P.R., AlJohani, M.D., Alsamadony, K.L., Abdallah, W., 2017. Fast and accurate shale maturity determination by Raman spectroscopy measurement with minimal sample preparation. International Journal of Coal Geology 173, 150-157.
- Schito, A., Romano, C., Corrado, S., Grigo, D., and Poe, B., 2017. Diagenetic thermal evolution of organic matter by Raman spectroscopy. Organic Geochemistry 106, 57-67.
- Shukla, P., Kumar, V., Curtis, M., Sondergeld, C.H., and Rai, C.S., 2013. Nanoindentation studies on shales, 47th US Rock Mechanics/Geomechanics Symposium. American Rock Mechanics Association.
- Spötl, C., Houseknecht, D. W., & Jaques, R. C., 1998. Kerogen maturation and incipient graphitization of hydrocarbon source rocks in the Arkoma Basin, Oklahoma and Arkansas: a combined petrographic and Raman spectrometric study. Organic Geochemistry, 28(9-10), 535-542.
- Tissot, B.P. and Welte, D.H., 1984. Diagenesis, catagenesis and metagenesis of organic matter, Petroleum Formation and Occurrence. Springer, pp. 69-73.
- Tuinstra, F. andKoenig, J.L., 1970. Raman spectrum of graphite. The Journal of Chemical Physics 53, 1126-1130.
- Tuschel, D., 2013. Raman spectroscopy of oil shale. Spectroscopy 28, 5.
- Tyson, R.V., 1995. Abundance of organic matter in sediments: TOC, hydrodynamic equivalence, dilution and flux effects, Sedimentary organic matter. Springer, pp. 81-118.
- Wang, Y., Alsmeyer, D.C., and McCreery, R.L., 1990. Raman spectroscopy of carbon materials: structural basis of observed spectra. Chemistry of Materials 2, 557-563.
- Wilkins, R.W., Boudou, R., Sherwood, N., Xiao, X., 2014. Thermal maturity evaluation from inertinites by Raman spectroscopy: the ‘RaMM’technique. International Journal of Coal Geology 128, 143-152.
- Wopenka, B., Pasteris, J.D., 1993. Structural characterization of kerogens to granulite-facies graphite: applicability of Raman microprobe spectroscopy. The American Mineralogist 78, 533-557.
- Zargari, S., Prasad, M., Mba, K.C., Mattson, E., 2011. Organic maturity, hydrous pyrolysis, and elastic property in shales, Canadian Unconventional Resources Conference. Society of Petroleum Engineers.
- Zhao, Q., Wagner, H.D., 2004. Raman spectroscopy of carbon–nanotube–based composites. Philosophical Transactions of the Royal Society of London A: Mathematical, Physical and Engineering Sciences 362, 2407-2424.

