Volume : 2 | Issue : 1
Technical Paper
Dynamic analysis approach to evaluate in-situ combustion performance for heavy oil production
Jia Yao1 and Yiming Song2
1Department of Petroleum Engineering, University of Wyoming, Laramie, USA
2Exploration and Development Research Institute of Liaohe Oilfield, China National Petroleum Corporation, Panjin, People’s Republic of China
Received: January 07, 2019 | Published: January 19, 2019
Abstract
In China, in-situ combustion has been widely used in heavy oil reservoirs due to its advantages, such as less thermal loss along the well bore, wider applicability range, higher displacement efficiency and so on. In order to operate the in-situ combustion successfully, it is necessary to fully require adequate production performance information. According to the principle and characteristics of in-situ combustion, dynamic analysis of in-situ combustion has been used to analyze the changes of some parameters, and corresponding rules on changes of these parameters have been achieved. Combining these drawn rules from previous results, such as reservoir pressure, produced gas compositions and combustion front position, with the developing requirements of the oil field, it is feasible to make necessary adjustments to enhance heavy oil recovery and increase profitability. Dynamic analysis on Gao 3-6-18 oil block, the main part of in-situ combustion pilot test reservoir in Liaohe Oilfield, was utilized to illustrate the feasibility of this dynamic analysis approach on evaluation of in-situ combustion performance for heavy oil production.
Keywords: In-situ combustion; heavy oil; dynamic parameters; dynamic analysis
Introduction
With the expansion of oil exploration and development, heavy oil reservoirs have received more interest, due to their wide distribution and sufficient reserves, in China.1 Different from the recovery from conventional oil reservoirs, where water-flooding is utilized as the most common production method, thermal production technology is the dominant method for heavy oil recovery, due to the characteristics of heavy oil, such as high viscosity and low mobility.2,3
Typical thermal oil production methods include steam injection (steam stimulation and steam flooding) and in-situ combustion.4–8 Steam injection is usually used at the initial stage of heavy oil production because of its low cost and simple operation. However, energy efficiency of steam injection is low, due to the heat lost in the steam generator, gas pipeline and wellbore, and the throughput effect significantly deteriorates during the middle or late stage of steam injection in the heavy oil reservoir. In addition, steam injection can also result in a rapid decline in oil production in ultra-heavy oil reservoirs.
In-situ combustion, with advantages such as broadly applicable reservoir conditions, low heat loss along wellbore and high oil displacement efficiency,9,10 has gradually replaced steam injection, becoming the dominant method of heavy oil production in China. Recently, several pilot tests have been conducted in some dominant heavy oil reservoirs, located in Shengli, Liaohe and Xinjiang oil regions.1 Results confirmed the feasibility and efficiency of in-situ combustion technology for these heavy oil reservoirs.
Dynamic analysis is regarded as the most effective method to understand the reservoir development status. After the resources are put into production, the underground fluids move and redistribute, following certain rules, with the development activities. Dynamic analysis of reservoir is to analyze the movement laws of underground oil, gas and water at different development stages in the oilfield development process, and to find out the changing characteristics and laws of the dynamic parameters of the reservoir, which can be utilized to evaluate the implementation effect of development plans, and to predict development and production trends of oilfield. In addition, based on the important information from dynamic analysis, the reservoir development plan can be reasonably adjusted to achieve optimal reservoir development. Therefore, the application of dynamic analysis in an in-situ combustion process is believed to enable more efficient development of heavy oil reservoirs.11,12 However, different from other oil production methods, in-situ combustion causes a more complicated condition of underground fluids, due to the gases produced from the combustion of oil layer.1 In this work, we have added a step as analysis of produced gas, during which the compositions of produced gas and amount of each component can be analyzed to estimate the progress of in-situ combustion. This dynamic analysis approach, following the order of dynamic analysis of oil block, dynamic analysis of well group and dynamic analysis of typical single well, has been used on Gao 3-6-18 oil block, the main part of in-situ combustion pilot test reservoir in Liaohe Oilfield, demonstrating the feasibility of this approach.
Theory and Method
Dynamic Analysis Theory
There are five categories of dynamic analysis theory can be divided into as follows.
Theoretical analysis
Well-test, well-log and other real-time data are used to get typical curves, such as well testing curves and pressure curves. These curves are used to determine the specific parameters, which affect the characteristics of production results.
Empirical analysis
An empirical formula can be determined by using the previous field data and combustion tube test (conducted in the laboratory) results. Then, dynamic parameters, such as oil production, gas production, water saturation and others, can be calculated from this empirical formula.
Simulation analysis
Simulation analysis can be further classified into physical simulation and numerical simulation. Physical simulation is to establish an in-situ combustion physical simulation device, and record the changes of parameters such as temperature, pressure at different time and positions during experiment. By making fully use of these data, optimized adjustments can be made. Numerical simulation is to establish a mathematical model of the developing block and make full use of finite difference to conduct nonlinear processing. The built model is used to simulate the change of dynamic parameters in the future and increase the predictability of adjustment.
Test analysis
A tracer, an intuitive measurement method, is used to periodically sample and analyze. The analysis results can provide the tracer yield curve, combustion direction and temperature field distribution.
Analogy analysis
Conduct comparative analysis of reservoirs with same or similar properties to summarize rules, in order to make reasonable adjustments. Comparison should be made between reservoirs with similar geological characteristics to summarize both successful and failure production experiences, which is instructive for subsequent development on reservoirs.
Procedures of in-situ combustion dynamic analysis
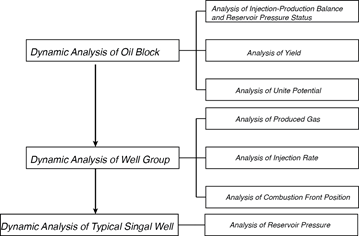
In an in-situ combustion process, air is injected through a central vertical well called injection well, which is surrounded by a number of production wells, and combustion initiated at the injection well sweeps the oil in the formation toward the production wells. Gas injection well and production well are the basic unite for an in-situ combustion procedure. By combining the dynamic changes of both gas injection wells and production wells in different ranges, the changes in production status of well groups, blocks and even entire reservoir can be reflected. Dynamic analysis is usually conducted from oil block, to well group, and finally to typical single well. The dynamic analysis procedure is shown in Figure 1.
|
Figure 1 Procedure of dynamic analysis approach to evaluate in-situ combustion performance for heavy oil production. |
Dynamic analysis of oil block
Considering the geological characteristics of the reservoir and the relationship between the injection well and production well, the same reserve layer in an oil reservoir, where in-situ combustion is applied, can be divided into several developing blocks. Dynamic analysis of these blocks usually includes: analysis of injection-production balance and reservoir pressure status, analysis of yield and analysis of unit potential.
Analysis of injection-production balance and reservoir pressure status
The pressure change of the reservoir is controlled by the balance of injection and production, and their changes are basically the same. When the injection-production balance is reached, the oil layer pressure is relatively stable; When the interlayer or same layer has an imbalance of injection and production, it will inevitably cause the unevenness of pressure in the corresponding interlayer or same layer. Therefore, the distribution of reservoir pressure can be used to reversely reflect the injection-production balance condition.
Analysis of yield
Generally, once in-situ combustion is conducted on the oil reservoir, the oil production amount is observed to increase obviously, as compared to the previous production period. However, similar to other oil production methods, after in-situ combustion lasts for a period, oil production will decline. The main reason for this result is that the injection well has reduced air intake capacity, and coke deposits at the production well. In addition, the strong emulsification of oil sand also has negative influence on oil production.
Analysis of unit potential
This potential analysis of a unit is conducted on the basis of the quantity and distribution of remaining oil in each reservoir. The analysis results include cumulative oil production, recovery degree and remaining recoverable oil amount in each unit.
Dynamic analysis of well group
The well group refers to a group of wells that consist of a gas injection well and several production wells centered on the gas injection well. An oil field or oil block is made up of a number of interconnected well groups. The well group dynamic analysis mainly includes the following contents: analysis of produced gas, analysis of gas injection rate, and analysis of combustion front position.
Analysis of produced gas
Studies on the compositions of produced gas and amount of each component can be used to estimate the progress of in-situ combustion, such as the combustion degree, the formation of combustion front and the propulsion of combustion. The percentage of oxygen in the produced gas is an important indicator of combustion efficiency, while the changes of total light ends in the produced gas are reflections of cracking, distillation and condensation. The various oxidation progresses in the oil formation can be decided based on changes in the compositions of produced gas and changes in the temperatures of wells. If oxygen usage efficiency is over 85% and hydrogen to carbon ratio is in the range of 1 to 3, this combustion degree is regarded as high temperature oxidation.
Analysis of gas injection rate
The gas injection rate directly affects the combustion front’s advancement rate. In addition, it is also a vital factor in maintaining combustion in the oil formation. Normally, the gas injection rate will gradually increase from small (at start of in-situ combustion) to large (as combustion lasts), and it will gradually decrease after reaching a maximum value for a period of time. There is a relation between the gas injection pressure and the gas injection rate. In the well-connected oil reservoir, the injection pressure will decrease slightly with the increasing gas injection rate, and then tend to be stable after a short period. However, if the connectivity of the oil reservoir is poor, it becomes difficult for the injection gas to move towards the ground, resulting in the injection pressure increase with the increasing gas injection rate. The liquid production rate is also very sensitive to the gas injection rate. If the liquid production rate increases significantly with the increasing gas injection rate, this result indicates that the combustion rate is intense in a short time. Under the premise of maintaining the combustion front stability, by increasing the gas injection rate, the liquid production rate will increase accordingly, leading to the increase of ultimate recovery.
Analysis of combustion front position
During the combustion process in the oil formation, the comprehensive dynamic analysis is utilized to estimate the position of the combustion front. When the combustion front arrives at the various distances away from the injection well, some parameters, such as the temperature in the production well, and liquid-gas production as well as their properties will change with combustion front locations. Comparing these change trends achieved from present working wells with the standard change trends, which are got from the previous normal working wells, it is possible to determine the combustion front location for this current in-situ combustion conduction. In addition, if the combustion front is moving evenly in both horizontal and vertical directions, it is possible to achieve an optimal sweep efficiency during an in-situ combustion process.
Dynamic analysis of typical single well
The physical properties of the oil reservoir and crude oil affect the progress of in-situ combustion. It is necessary to clarify the number of perforated layers, the layer thickness, the perforation condition, the permeability of each layer and the connectivity of the surrounding production wells. The impurities in the oil layers and poor properties of oil will cause the loss of injection capacity in the injection well, as well as the loss of production capacity in the production well.
During an in-situ combustion process, the oil is mainly produced from the production well under the air pressure-driven procedure. The injection-production well ratio (number ratio) affects the formation pressure directly. With the reliable data, it is possible to optimize the injection-production well ratio. Generally, once the in-situ combustion starts, the pressure of the reservoir will decrease compared with the initial pressure with air injection, but with the success of the combustion, the reservoir pressure will generally recover, or even increase from the initial pressure. Therefore, reservoir pressure is a typical parameter, which should be investigated for the typical single well during an in-situ combustion process.
Results and Discussions
Since Liaohe Oilfield (Figure 2) is one of the major heavy oil production area in China, several pilot tests of in-situ combustion have been conducted in Liaohe Oilfield. Gao 3-6-18 oil block, which is located in the northeast of Liaohe Gaosheng Oilfield, is the main part of the in-situ combustion test block. Our proposed dynamic analysis approach was applied to Gao 3-6-18 to evaluate the performance of in-situ combustion in this block.
Analysis of oil block Gao 3-6-18
Gao 3-6-18 is a typical deep heavy oil reservoir, with reserve burial depth of 1540~1890m, reservoir thickness 96.8m, porosity 20.6% and permeability 1014.1md.1 Steam injection had been conducted on Gao 3-6-18 block for a period, after which high water saturation was observed in the produced liquid. Considering the economic benefits, in-situ combustion was conducted on this block in 2008.
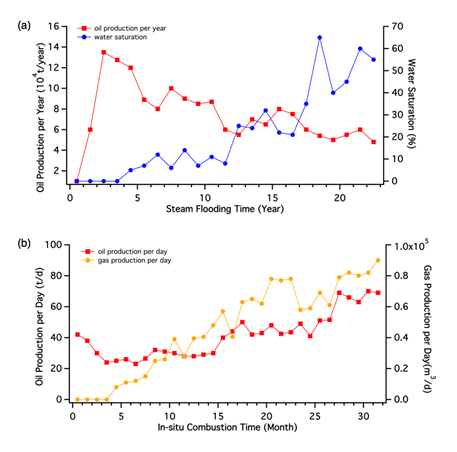
Figure 3(a) shows the changes of oil production and water saturation in produced liquid in Gao 3-6-18 block during steam injection procedure, while Figure 3(b) is for oil production and gas production in Gao 3-6-18 block during in-situ combustion process. During the later period of steam injection, oil production amount decreased significantly, and water saturation increased to 58%. After in-situ combustion was conducted in this block, oil production started to increase generally, indicating the initial effect of in-situ combustion in this block.
Analysis of well group in Gao 3-6-18
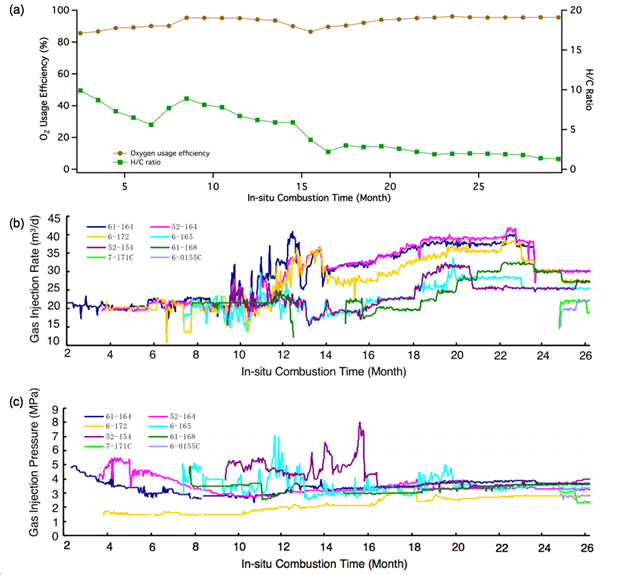
The dynamic analysis of typical well group was carried out by taking the first well group in Gao 3-6-18 oil block as an example. Figure 4(a) shows the gas component content in the first well group in Gao 3-6-18 oil block. Results show that oxidation in this group well gradually transferred into high temperature oxidation combustion state at the 8th month of in-situ combustion, since oxygen usage efficiency reached 85%. Oxygen usage efficiency achieved as high as 96.1% at the 28th month of in-situ combustion in Gao 3-6-18 oil block. The hydrogen-to-carbon ratio was achieved at 1.4, falling in the range of 1 to 3, at the 28th month of in-situ combustion, indicating that the formation gradually shifted into and maintained a stable high temperature combustion state and the combustion range continuously expanded.
Figure 4(b) and Figure 4(c) show the gas injection rate and the gas injection pressure respectively. It can be observed that the gas injection rate in the first well group in Gao 3-6-18 gradually increased, and the gas injection pressure changed from the initial value in the range of 3 to 5MPa, then tended to be stable after a little decrease. These results indicate that the reservoir was well-connected and the injected air was gradually advancing underground.
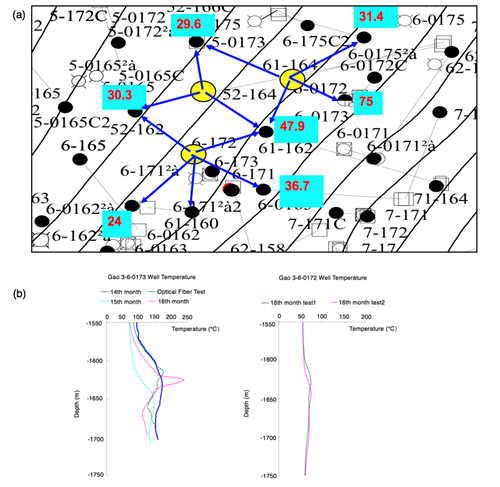
Figure 5(a) shows the combustion front propulsion distance around the three electric ignition wells, represented by yellow color. The maximum propulsion distance was 75m while the minimum value was 24m. The combustion front propelled with different speeds, causing break through phenomenon. To estimate the one-way rush direction, Gao 3-6-0173 and Gao 3-6-0172 well temperature curves were used to analyze the temperature distribution in these two wells, as shown in Figure 5(b). At the same measured time (the 16th month of in-situ combustion), and the same depth in the reservoir (1625m), the temperature of Gao 3-6-0173 was much higher than that of Gao 3-6-0172, indicating that the combustion front propelled faster along the direction of Gao 3-6-0173, and it was believed that the break through followed in this direction was caused by the better physical properties of reservoir in this direction.
|
Figure 5 (a) Combustion front propulsion distance map of the first well group in Gao 3-6-18 oil block. (b) Gao 3-6-0173 and Gao 3-6-0172 well temperature curves. |
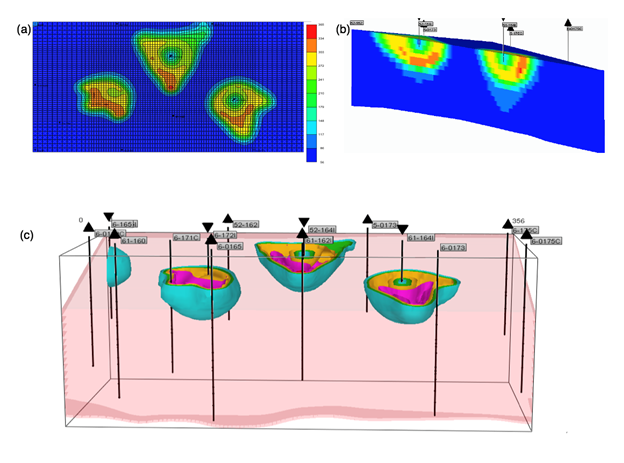
Numerical simulation was utilized to achieve the digital temperature distribution diagram for the L51 oil layer in the Gao 3-6-18 oil block, as shown in Figure 6(a), indicating that combustion front advancing speed was around 4cm/d and propelled distance was 30 to 50 meters in the horizontal direction. Figure 6(b) shows the temperature distribution profile, illustrating that combustion front moving speed was around 3.2cm/d and advancing distance was 10 to 20 meters in the vertical direction. The spatial temperature distribution is shown in Figure 6(c). It was observed that combustion front moving speed in the horizontal direction was higher than that in the vertical direction, while the speed kept increasing in the horizontal direction, causing more difference between these two directions. Therefore, while maintaining high temperature oxidation combustion, the gas injection rate should be properly controlled to uniformly promote the advancements of combustion front in both horizontal and vertical directions, in order to improve the in-situ combustion sweep efficiency.
Table 1 shows the oil production information of the first well group in Gao 3-6-18 oil block before and after in-situ combustion procedure. It was observed that oil production per day for this well group reached 47.3t/d, which increased by 18.2t/d as compared with that before in-situ combustion. The single well average daily oil production was 2.1 times of that before in-situ combustion. Therefore, the increase of oil production output was observed in this well group after in-situ combustion, indicating the positive effect of in-situ combustion on oil recovery in this well group and Gao 3-6-18 oil block.
Analysis of Typical Single Well in Gao 3-6-18
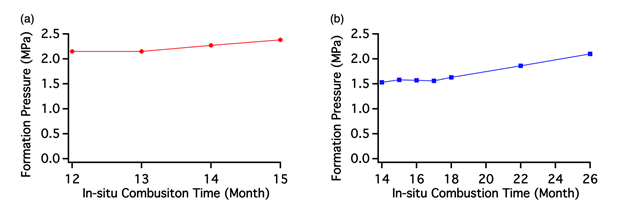
Figure 7(a) and Figure 7(b) show the formation pressure measured from two wells, Gao 3-6-171C (a production well) and Gao OB-22 (an observation well), at reservoir depth of 1580m and 1570m respectively. For both the production well and the observation well, the formation pressure was observed to increase after in-situ combustion, confirming the success of in-situ combustion in the oil formation.
|
Figure 7 (a) Formation pressure measured from Gao 3-6-171C at depth of 1580m. (b) Formation pressure measured from Gao OB-22 at depth of 1570m. |
Through the dynamic analysis results of Gao 3-6-18 oil block, in-situ combustion achieved ideal results, including successful ignition, stable gas injection, high temperature combustion and increased yield. Since the utilization of microfluidic devices for oil production studies13,14 has been regarded as a technological advancement, if a laboratorial test on a microfluidic device with several certain-located microwells can be used to optimize production/injection well ratio, oil production may be further improved.
Conclusions
For heavy oil reservoirs, after long period of steam injection procedure, the reservoirs usually have some issues, such as high water saturation in the produced liquid, low formation pressure, and low oil recovery. In-situ combustion is an effective alternative technology for the continuous development of these reservoirs. It is necessary to conduct dynamic analysis of in-situ combustion, enabling the more effective development of heavy oil reservoirs and achieving enhanced oil recovery. From the dynamic analysis date of oil block, well group and typical single well, the dynamic formation parameters, such as gas injection rate, gas injection pressure, combustion front location and formation pressure, can be obtained. By making use of these parameters and their corresponding change trends, it is possible to make reasonable adjustments of production indicators. The dynamic analysis of production utilized on Gao 3-6-18 oil block in Liaohe Gaosheng Oilfield verified the regularity of dynamic analysis of in-situ combustion, and successfully achieved the development goal of increasing oil production in this oil block.
References
- Yao J, Li G, Wu J. Application of In-situ combustion for heavy oil production in China: A Review. J Oil Gas Petrochem Sci. 2018;1(3):69–72.
- Green DW, Willhite GP. Enhanced Oil Recovery. Vol 6. Henry L. Doherty Memorial Fund of AIME, Society of Petroleum Engineers …; 1998.
- Thomas S. Enhanced oil recovery-an overview. Oil & Gas Science and Technology-Revue de l’IFP. 2008;63(1):9–19.
- Prats M. A current appraisal of thermal recovery. Journal of Petroleum Technology. 1978;30(08):1–129.
- Cinar M, Castanier LM, Kovscek AR. Combustion kinetics of heavy oils in porous media. Energy & Fuels. 2011;25(10):4438–4451.
- Moore RG, Laureshen CJ, Belgrave JD, Ursenbach MG, Mehta SR. In situ combustion in Canadian heavy oil reservoirs. Fuel. 1995;74(8):1169–1175.
- Gu H, Cheng L, Huang S, et al. Steam injection for heavy oil recovery: modeling of wellbore heat efficiency and analysis of steam injection performance. Energy Conversion and Management. 2015;97:166–177.
- Sun F, Yao Y, Chen M, et al. Performance analysis of superheated steam injection for heavy oil recovery and modeling of wellbore heat efficiency. Energy. 2017;125:795–804.
- Bagci S, Kok MV. In-situ combustion laboratory studies of Turkish heavy oil reservoirs. Fuel processing technology. 2001;74(2):65–79.
- Shen C. Limitations and potentials of in-situ combustion processes for heavy oil reservoirs. In: Canadian International Petroleum Conference. Petroleum Society of Canada; 2002.
- Hallam RJ, Moore RG, Krouse HR, Bennion DW. Carbon isotope analysis: a new tool for monitoring and interpreting the in-situ combustion process. SPE Reservoir Engineering. 1990;5(04):517–523.
- White PD. In-situ combustion appraisal and status. Journal of petroleum technology. 1985;37(11):1–943.
- Yao J, Oakey J. Geometrically-mediated snap-off of water-in-oil emulsion droplets in microfluidic flow focusing devices. Journal of Oil, Gas and Petrochemical Sciences. 2018;1(2):42–46.
- Qu Z, Yao J, Wang B, He L. Laboratory experiments of a microfluidic model for imbibition. Journal of Petrochemical Universities. 2014;27(3):64-66. doi:10.3969/j.issn.1006-396X.2014.03.014
