Volume : 1 | Issue : 2
Research
Use of HPLC and FTIR as a tool for analysis of lactic acid in restructured fish products
Huisuo Huang, Ingolf U. Grün, Mark Ellersieck, Andrew D. Clarke
University of Missouri, Food Science Department, USA
Received: May 11, 2018 | Published: June 04, 2018
Abstract
Lactic acid has been applied into various meat products to improve their functional properties. It has antimicrobial properties and can be used as a washing agent for meat products. It reduces the pH of the meat and slows the hydrolysis process. It also allows the gradual development of calcium bridging and the formation of a gel network with sodium alginate in restructured meat system. In this study, a HPLC method using an ion exchange column and a UV detector, and a Fourier transform infrared (FTIR) method using a partial least squares (PLS) regression method were developed to quantitate the amount of lactic acid in restructured fish samples. The results showed that these methods can successfully determine the amount of lactic acid in fish products. Both of these methods are simple, fast and can be used by quality control in the food industry.
Keywords
fish, FTIR, HPLC, lactic acid
Introduction
Lactic acid, also called α-hydroxypropionic acid or 2-hydroxypropanoic acid, is a white crystalline solid with a very low melting point. Lactic acid has two optical isomers, L (+) and D (-). L (+)-lactic acid is a biological isomer that is naturally present as a metabolic intermediate in the human body, whereas D (-)-lactic acid is primarily produced by bacteria, plants, and some types of algae. L (+)-lactic acid has been widely used as an additive in the food industry as a flavoring agent and preservative in cheese, salad dressing, pickles, and beverages. L-lactic acid can be produced by the bacteria in many fermented dairy products, pickled products and cured meats and fish.1Because of this, the control of lactic acid in fermented food, such as beer, yogurt, cheese, milk, and other dairy products is critical to ensure food quality. Due to the widespread use of lactic acid, the quantitation of lactic acid is of great interest in food industry.
Many studies have been conducted to validate different functionalities of lactic acid. Berge et al2 investigated the tenderization of beef using lactic acid solution as a softening and flavoring agent. The function of lactic acid is to decrease the resistance of meat, and soften the collagen-rich tough muscle. Injecting lactic acid solution into muscle meat reduces mechanical strength and increases tenderness. In addition, many experiments have been conducted to decontaminate muscle food with lactic acid by either spraying or immersion. Beyaz and Tayar3 ascertained that spraying 2.0% lactic acid on sheep carcasses immediately after slaughter could significantly reduce the numbers of Coliform and E. coli and increase shelf life. Bosilevacet al4 addressed that in the meat industry, 2.0% lactic acid spraying applied to carcasses pre-evisceration can reduce aerobic plate count and Enterobacteriaceae. Carpenter et al5 indicated that 2.0% lactic acid or acetic acid is commonly used in industry for decontamination. It has been suggested as one critical control point in hazard analysis and has been considered as a critical limit to reduce pathogens.
Another lactic acid application is its addition into restructured meats. Schmidt and Means6 first formulated sodium alginate, calcium and lactic acid into raw restructured beef. The meat particles were bound together by the reaction of sodium alginate and calcium carbonate which formed an alginate/calcium gel system, aided by the addition of lactic acid. Mukherjee et al7 developed a meat model system for restructured beef products, including salt/phosphate, algin/calcium, Activa® RM, and Fibrimex with and without lactic acid and compared the inactivation levels of E. coli O157:H7 in ground beef. Ren8 performed a study to compare the effect of different lactic acid sources on alginate systems in restructured fish. The lactic acid sources included lactic acid from bacteria, encapsulated lactic acid, and a powdered form of lactic acid. Rahman9 compared encapsulated organic acids, such as lactic, citric and glucono delta-lactone (GDL), which were added to restructured products for the development of color and flavor in meat emulsions. The encapsulated lactic acid can control the pH decrease and prevent unexpected protein binding during blending.
USDA-FSIS updated the list of approved substances and antimicrobial interventions that are safe and suitable to add into meat products.10 Lactic acid was included with various antimicrobial combinations and maximum usage rates for different types of raw and ready to eat meat products. Besides the antimicrobial functions, lactic acid in meat products can influence flavor, stability, and overall quality of the meat. The quantitative determination of lactic acid in these meat applications is required for quality control purposes, for which the product has to meet required laws and regulations as well as meeting label requirements.
To date, the present analytical methods for the determination of lactic acid in foods include colorimetric methods,11 Gas Chromatography (GC), and High Performance Liquid Chromatography (HPLC) methods. Although some of these methods are accurate, these assays have major drawbacks. For example, colorimetric methods can be time consuming and lack specificity; GC method requires derivatization of lactic acid before analysis. Some methods are expensive or cannot provide the results quickly. Many studies have been carried out to determine organic acids in fruits and fruit juices by HPLC. Many studies have been used FTIR spectroscopy for the identification of lactic acid bacteria in milk. However, there are limited reports about quantification of lactic acid in fish products. Yoshida et al12 analyzed organic acids from raw fish meat, liquefied under supercritical conditions by HPLC.
The aim of this study was to use HPLC to determine the amount of lactic acid in restructured meat and fish fillets that had been washed with different lactic acid solutions. Another objective of this study was to evaluate the feasibility of using FTIR to quantify lactic acid in meat products and to develop a rapid methodology for monitoring the meat quality.
Materials and methods
Materials and chemicals
Swai fillets were purchased at a local grocery store. The fish had been farm-raised and produced in Vietnam. The fillets were individually vacuum packed and sold in a frozen state (-18°C). The fillets were thawed under refrigerated conditions overnight before analysis. The 0.45 µm membrane filters and HPLC-grade water were purchased from Fisher Scientific (Pittsburgh, Penn., USA). L-lactic acid (88%), acetonitrile and 95-98% H2SO4with high purity solvent were purchased from Sigma Chemical Corporation (St. Louis, MO, USA). All the other reagents used in this study were analytical grade. Stock solutions of lactic acid were prepared with HPLC-grade water. The following concentrations of lactic acid solutions were used for generating a standard curve: 0, 0.25, 0.5, 1.0, 2.0, 4.0, and 6.0 mg/ml.
Sample preparation-restructured meat
For restructured fish muscle sample preparation, fish samples were thawed under refrigerated conditions overnight. The semi-thawed fillets were cut into small pieces and then blended for 1 min in a food processor (Cuisinart® Prep 9™9-Cup Food Processor, Model DLC-2009CHBM). There were four treatments, which include the control (without sodium alginate system), 0.5%, 1%, and 2% sodium alginate based on meat weight. The ratio of sodium alginate (Danisco, Kansas City, KS), calcium carbonate (Danisco, Kansas City, KS), and encapsulated lactic acid (IFP, St. Paul, MN) was held constant to 1:0:6.0:1.5 (Table 1). The pre-determined amount of sodium alginate was sprinkled into the paste, then calcium carbonate was added, encapsulated lactic acid was added the last step with limited mixing after that. Encapsulated lactic acid is a small bead of acid surrounded by a lipid coating. The acid should be gently mixed and blended into the alginate/calcium gel system near the end of final mixing. Extra mixing after adding acid could disrupt the lipid coating. Lactic acid was added in encapsulated form because encapsulated acids are released more slowly and thereby prevent texture breakdown. Adding non-encapsulated lactic acid or acetic acid during the mixing processing can cause the meat protein to coagulate, and negatively impact the meat texture. The samples were set at refrigeration temperature overnight to set the gel.
Treatment |
Meat (g) |
Sodium alginate (g) |
CaCO3(g) |
Encapsulated lactic acid (g) |
|---|---|---|---|---|
Control |
300 |
0 |
0 |
0 |
0.5% SA |
300 |
1.5 |
0.25 |
0.375 |
1.0% SA |
300 |
3 |
0.5 |
0.75 |
2.0% SA |
300 |
6 |
1 |
1.5 |
Table 1 The formulations of restructured meat treatments
*SA: Sodium alginate
Sample preparation-immersion
Solutions of lactic acid, ranging from 1% to 5%, were prepared in advance. The raw fish samples were exposed to different concentrations of lactic acid by immersion for 10 minutes, distilled water was used as control. Then the fish samples were air-dried for 5 minutes before sample pretreatment.
Sample pretreatment
The lactic acid was separated from the meat samples by centrifugation and filtration methods. Ten grams of fish fillet or samples were placed into a stomacher bag. 90 ml distilled water was added, then the stomacher bag was manually massaged for 2 min. The slurry was filtered through cheesecloth twice, and then filtered with a Buchner funnel and metallic vacuum trap with Whatman® Grade 1 Qualitative Filter Paper. This procedure was repeated several times until the desired amount of liquid was collected. The filtered solutions were kept under refrigerated conditions. The filtrate was transferred into 2 ml tubes with pipette for centrifugation. The 2 ml tubes were centrifuged at 100,000 rpm at room temperature for 15 min. After centrifugation, the upper phase of liquid was filtered through a 0.45 µm filter before being analyzed by HPLC and FTIR.
HPLC separation and quantifications
All chromatographic separations were carried out at ambient temperature. The HPLC consisted of pump, column, autosampler, UV detector and a Galaxie Chromatography software system. The HPLC system was equipped with a UV absorbance detector (LC90 UV spectrophotometric detector, Perkin-Elmer, Norwalk, CT) set at 210 nm, and the column temperature was set at 55°C. Chromatographic separation was performed with Aminex HPX-87H Ion Exclusion Column, 300 mm x 7.8 mm (Bio-Rad Laboratories Inc, Hercules, CA). The mobile phase consisted of acetonitrile (6%) and 0.045 N H2SO4, witha flow rate of 0.5 ml/min. A volume of 20 µl aliquots of the individual standards, which were a series of lactic acid concentrations, were auto-injected (Varian-Agilent Technologies, Santa Clara, CA) into the column and the retention time of lactic acid was determined. The lactic acid calibration curve was determined using the Galaxie Chromatography software. All samples were injected and run using the determined procedure.
pH analysis
Ten grams of raw fish fillet or samples were placed into a stomacher bag. Then, 90 ml of distilled water was poured into the stomacher bag. The stomacher bag was manually massaged for 2 min, and subsequently, the slurry was filtered through cheesecloth twice. The pH of the meat slurry was determined using a Fisher Accumet Model 230A pH/ion meter (Fisher Scientific Inc., Salt Lake City, UT). The pH meter was calibrated using pH buffers 4.00, 7.00 and 10.00. The probe was placed into the sample homogenate and allowed to equilibrate for 1 min before the pH reading was recorded. All pH readings were performed in triplicate.
Moisture analysis
Moisture content determination was determined by following the Association of Official Analytical Chemists AOACmethod13 (950.46) with modifications. Three grams of raw paste and cooked fish samples were placed in an aluminum tray and dried in a vacuum oven at 80°C for 24 h at 23 kPa, and cooled to room temperature in a desiccator prior to taking final weights. Three samples per treatment were measured. Moisture (%) was calculated using the following equation:
W1 represents the weight before drying, g
W2 represents the weight after drying, g
Water holding capacity (WHC) analysis
Ten grams minced cooked samples were placed into a 40 ml tube containing 30 ml of distilled water and vortexed (Vortex Genie 2 TM Cat. No. 12-812 Model G 250, Fisher Scientific, McGaw, IL) for 1 min to ascertain even distribution. The tube was placed into a 4°C refrigerator for 15 min prior to centrifugation. The mixture was centrifuged at 4591g (Sorvall RC-5B, Beverly, MA) at 4°C for 15 min. After centrifugation, the supernatant was collected, and the sample was allowed to stand for 1 min. The liquid was then decanted, and solid meat particles were kept in the tube.14 WHC (%) was determined by using the following equation:
Where W1 represents solution added into the sample, g
W2 represents solution removed after, g
W3 represents the meat samples mass, g
Recovery studies
A standard addition technique was employed to determine the percent recovery of lactic acid from both restructured fish and immersion samples. This method can be used to verify the effectiveness of the extraction step and to confirm the accuracy of the method used in this experiment. The recovery studies were carried out by injecting known standard lactic acid concentrations into the samples prior to extraction. The percentage recovery was calculated using the following equation:
FTIR spectroscopy measurements
FTIR analysis was carried out using a Thermo Nicolet 380 FTIR spectrometer (Thermo Electron Corporation, Madison, WI, USA) The FTIR spectra using Attenuated Transmission and an internal reflection accessory made of composite zinc selenide and diamond crystals. Each spectrum was scanned from 4000 to 400 cm-1. The FTIR spectra were acquired for each treatment at room temperature. Each spectrum was composed of an average of 32 separate scans at a resolution of 4 cm-1. The software Delight Version 3.2.1 (D-Squired Development Inc., La Grande, OR, USA) was used for data analysis. Data pre-processing algorithms including polynomial substrate and Gaussian smoothing were used to subtract the baseline shift and to eliminate high-frequency noise from the spectra. The partial least squares (PLS) model, a multivariate statistical regression model, was used to predict the analyte concentrations in tested samples. The number of PLS latent variables was optimized based on the lowest root mean square error of prediction (RMSEP) values to avoid over-fitting of spectral data.
Statistical analysis
One-way analysis of variance was done using the General Linear Model (PROC GLM) of Statistical Analysis System (SAS) computer package (SAS Institute Inc., 2005). Subsequently, Tukey's range tests were conducted to separate means.
Results and discussion
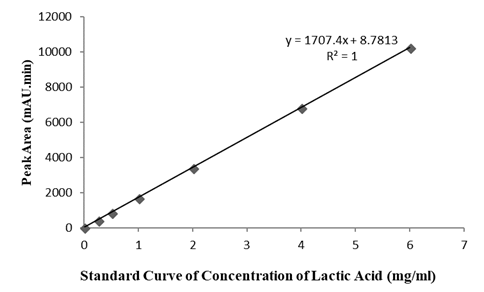
The calibration graph obtained was linear from 0.25 to 6.0 mg/ml for lactic acid with a coefficient of determination (R2) of 1 (n=6) (Figure 1). The LOD (limit of detection) and LOQ (limit of quantification) were determined based on the calibration curve. The residual standard deviation of a regression line or the standard deviation of y-intercepts of regression lines may be used as the standard deviation. Based on the standard deviation of the response and the slope,
Where σ = the standard deviation of response
S = the slope of the calibration curve
In this study, the slope S was estimated from the calibration curve of the analyte. The estimate of σ was calculated based on the residual standard deviation of the regression line. The LOD was 0.016 mg/ml, while the LOQ was 0.05 mg/ml. The relative standard deviation (RSD based on n=8) was 2.0% for the determination of a 4.0 mg/ml lactic acid standard solution. These values proved the reproducibility and repeatability of this method. The accuracy of the method was determined based on the recovery rate. The range of recovery was 85.6% to 125.3%. The control samples were not spiked with any lactic acid. The lactic acid content and ultimate pH of post-mortem meat varies greatly depending on animal species, muscle type, feeding and levels of stress and exercise.
Determination of lactic acid in restructured meat samples by HPLC
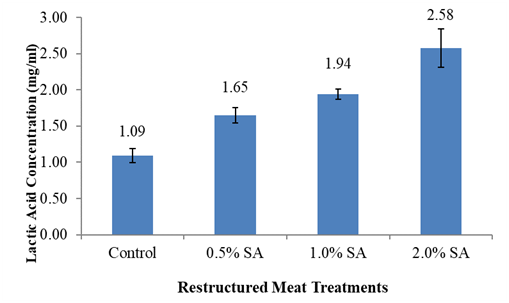
Samples were prepared and tested as described previously. Based on the results shown in Figure 2, it can be calculated that the average amount of lactic acid contained in the raw fish was 9.81 mg/g. There was a positive linear relationship between amounts of tested and spiked lactic acid. The following equation was developed to show the relationship:y = 0.465x + 0.0367, R² = 0.9549. The results further confirmed that centrifugation and filtration was a suitable extraction method. HPLC can be used to quantify lactic acid, or encapsulated lactic acid that was pre-added to meat samples.
|
Figure 2 The HPLC results of lactic acid concentration in restructured meat treatments.
|
Determination of lactic acid in immersion samples
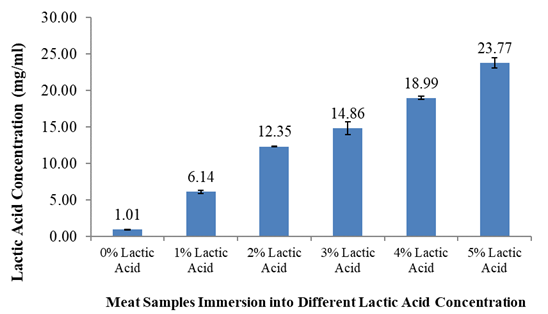
The results shown in Figure 3 demonstrate that when fish samples were immersed into higher concentrations of lactic acid, as expected, a higher amount of residual lactic acid was found on the surface of meat sample. This initial experiment is an indication that the extraction method can be used to analyze lactic acid in all types of meat samples, not just restructured fish.
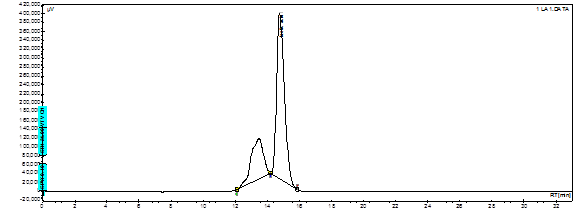
The results in Table 2 demonstrate the recovery rate when fish samples were injected with different concentrations of lactic acid from 1% to 5%. Recovery rates range from 93.8% to 105.7%. Figure 4 shows an example of a standard chromatogram of lactic acid; the retention time was determined to be around 14.77 min.
Treatment |
Recovery rate (%) |
|---|---|
1% Lactic acid |
105.7 |
2% Lactic acid |
112.7 |
3% Lactic acid |
93.8 |
4% Lactic acid |
99.1 |
5% Lactic acid |
104.4 |
Table 2 The recovery rate of lactic acid spiked in fish samples
*SA: Sodium alginate
Water holding capacity (WHC), pH and moisture analysis of two different types of samples
The data (Table 3) demonstrate that restructured fish pH values decrease as the concentration of sodium alginate, and concurrently lactic acid increase. The pH values of the control samples were significantly higher than samples treated with sodium alginate (P< 0.05). However, there was no difference among sodium alginate treated samples. The control sample also had higher moisture than samples treated with sodium alginate (Table 3), but not significantly higher when compared with 1.0% sodium alginate treated samples.
Treatment |
WHC |
Moisture |
pH |
|---|---|---|---|
0% Sodium alginate |
8.80c |
85.32a |
8.03a |
0.5% Sodium alginate |
31.21b |
82.37b |
7.92b |
1.0% Sodium alginate |
39.36a |
83.50ab |
7.89bc |
2.0% Sodium alginate |
46.77a |
82.85b |
7.83c |
Table 3 The attributes of restructured fish on WHC*, moisture, and pH values
a-cMeans in same column with different superscripts are significantly different (p<0.05)
*WHC: water holding capacity
The WHC results are also shown in Table 3. There were significant differences in WHC among treatments. The WHC for all sodium alginate treatments was much higher (P> 0.05), when compared to the control. While there was an apparent increase in WHC as sodium alginate levels increased from 0.5% to 1.0%, the increase was not significant between samples treated with 1.0% and 2.0% sodium alginate. Compared with control samples, sodium alginate treated samples had higher WHC, lower moisture and lower pH values.
FTIR analysis
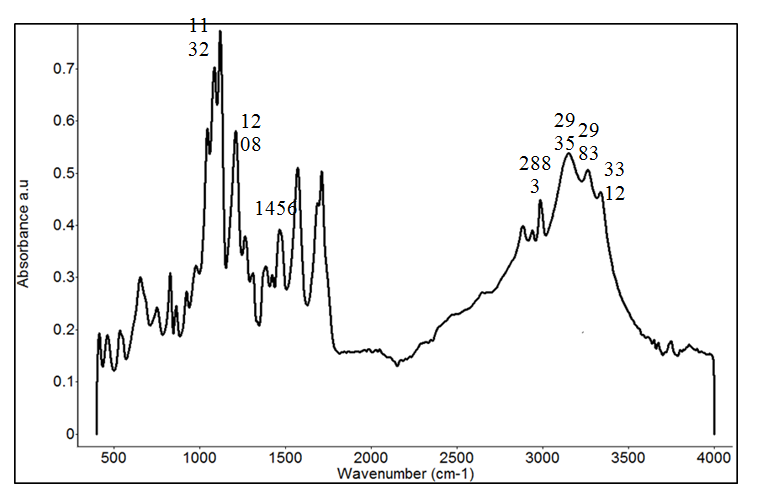
Different concentrations of lactic acid solutions spiked into fish sample solutions were analyzed by FTIR. The most prominent peak of lactic acid was at about 1132 to 1150 cm-1, which can be observed in the FTIR spectra collected from both spiked lactic acid samples and the powdered L-lactic acid (Figure 5). Second derivative transformation can be used to separate overlapped peaks, eliminate baseline effects, and enhance spectral resolution, and is therefore used as a common tool to analyze the spectra. Figure 5 shows a typical FTIR spectrum of powdered L-lactic acid. FTIR intensity at ~3312 cm-1 is associated with O-H stretching. It may relate to water content in the tested lactic acid powder. C-H stretching bands are located at 2983, 2935, and 2883 cm-1. CH3is responsible for the appearance of the band at 1456 cm-1. The bands at ~2997 cm-1and 2945 cm-1come from the CH3 asymmetric and symmetric stretching. The bands at ~2854 and 2926 cm-1come from the organic modifiers and are not present in pure lactic acid solution or powder. The band at 1454 cm-1 is attributed to the asymmetric deformation mode of CH3, is split into two bands at 1458 and 1442 cm-1. The region of 1300 to 1000 cm-1 is related to the C-O-C stretching vibrations, it is also related to band splitting, and peak shifts. The peak at 1200 cm-1 is due to the C-O-C asymmetric vibrations linked with asymmetric CH3 rocking vibrations, and it shifts to higher wavenumbers with stronger intensity. This band is split into two peaks at around 1210 and 1180 cm-1.15Vodnaret al16 summarized the peak assignment of L-lactic acid and addressed that the peak intensity at 1760 and 873 cm-1are its characteristic peaks.
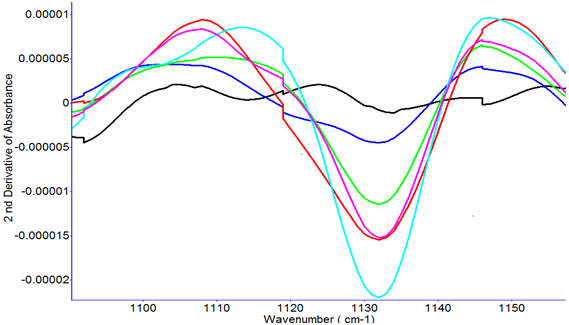
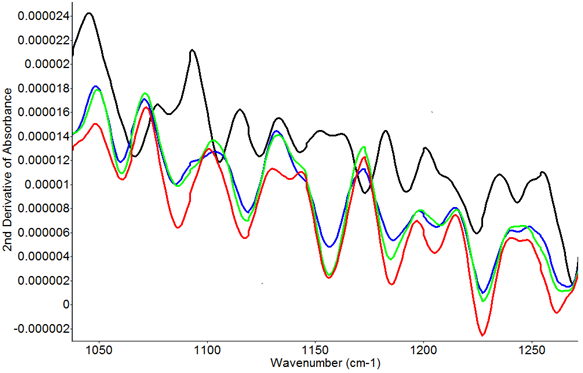
Figure 6 and Figure 7 show the second derivative transformation FTIR spectra from fish supernatant spiked with different concentrations of lactic acid, and lactic acid extracted from meat treated with different concentrations of sodium alginate and lactic acid. Figure 6 clearly shows the difference between the control and higher concentrations of lactic acid at ~1132 cm-1. Figure 7 shows the second derivative transformation of FTIR spectra in the range of 1050 to 1250 cm-1. The samples without lactic acid treatment can be easily differentiated from the samples treated with lactic acid and sodium alginate. Yoshida et al12 pointed out the most prominent peak of L-lactic acid was at around 1127 cm-1. In this study, the wavenumber 1132 cm-1 was used as the identifying peak of L-lactic acid in spiked fish.
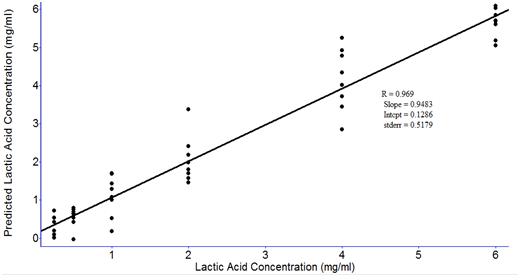
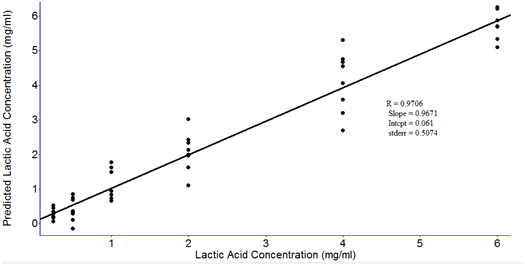
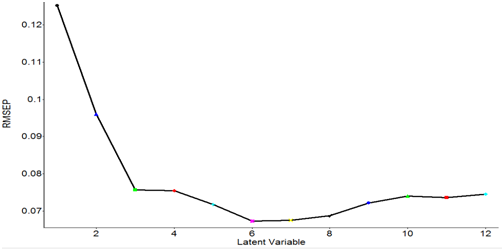
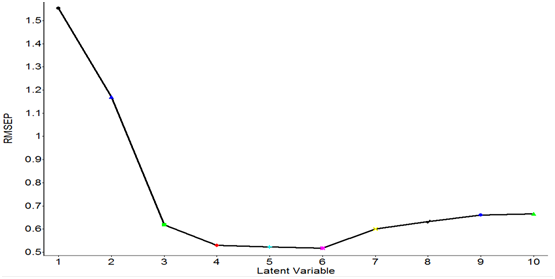
RMSEP values obtained from the PLS models with different latent variables are shown in Figure 8. The data were processed with smoothing at 4 cm-1and 2nd order polynomial subtraction and second derivative at 12 point in the entire spectral region from 4000 to 400 cm-1. The lowest RMSEP values were obtained when the four latent variables were used (Figure 8). Therefore, the optimal number of latent variables to perform PLS model was four. Figure 9 shows the PLS prediction results for concentrations ranging from 0.25-6.0 mg/ml. The prediction results were achieved with R of 0.969 and RMSEP of 0.5179. Figure 10 shows the PLS prediction results with concentrations of lactic acid ranging from 1% to 5%. The prediction results were achieved with R of 0.9706 and RMSEP of 0.5074.
|
Figure 8 Root mean square error of prediction (RMSEP) values obtained from the partial least squares (PLS) models with different latent variables. |
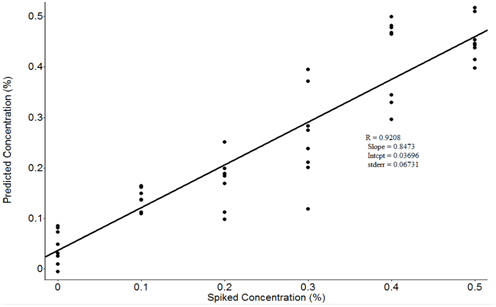
Figure 11 and Figure 12 show the latent values and spiked predicted lactic acid values. The prediction results were achieved with R = 0.9208 and RMSEP = 0.067. Figure 11 shows the PLS prediction results with spiked samples of 1.0 % to 5.0 % lactic acid. Therefore, in theory, the final solution concentrations become 0.1% to 0.5%. These results indicate that satisfactory quantitative results for lactic acid could be obtained by FTIR method. However, current methods cannot be used if the lactic acid was added in very low amounts. From all these results, it can be concluded that more improvements are needed. The standard deviation should be as low as possible to improve the reproducibility of the measurement. In addition, water content in tested samples may interfere with other food components and increase the difficulty of measurements. Experiments should be performed to reduce the interference from other food components and improve PLS prediction models.
Conclusion
The extraction method used in this study is a simple and an accurate analytical method for determining lactic acid or encapsulated lactic acid content in meat samples. There were no steps for fat removal and protein precipitation, which saves time and chemical reagents. Using cheesecloth to remove residual meat, along with centrifugation helped the slurry pass through the HPLC filter, reducing sample preparation time and preventing any potential clogging of the HPLC column. In this study, two common types of lactic acid applications were investigated: encapsulated lactic acid and sodium alginate system in restructured meat, and spraying meat with a lactic acid solution. These extraction methods and analytical tools, such as HPLC and FTIR, provide references for food manufacturers if they are interested in understanding the amount of lactic acid or other types of organic acids affecting meat quality. Overall, this research showed that both HPLC and FTIR could be used to analyze the content of various types of lactic acid.
In the both the HPLC study and the FTIR study, samples were prepared by centrifugation and filtration. The results showed that this simple preparation FTIR has the potential to quantify the amount of lactic acid in meat samples. However, compared with HPLC methods, it requires more technical handling and analysis to obtain specific results. Compared with HPLC, FTIR cannot provide exact values and can only predict the possible amount. It still has potential to be used in the food industry; however, more work is needed to identify more parameters and meat quality changes during storage or other types of food processing.
References
- Vargas E, Ruiz MA, Campuzano S, et al. Implementation of a new integrated d-lactic acid biosensor in a semiautomatic FIA system for the simultaneous determination of lactic acid enantiomers. Application to the analysis of beer samples. Talanta. 2016;152:147–154.
- Berge P, Ertbjerg P, Larsen LM, et al. Tenderization of beef by lactic acid injected at different times post mortem. Meat Sci. 2001;57(4):347–357.
- Beyaz D, Tayar M. The effect of lactic acid spray application on the microbiological quality of sheep carcasses. J Anim Vet Adv. 2010;9(13):1858–1863.
- Bosilevac JM, Nou X, Barkocy-Gallagher GA, et al. Treatments using hot water instead of lactic acid reduce levels of aerobic bacteria and Enterobacteriaceae and reduce the prevalence of Escherichia coli O157: H7 on preevisceration beef carcasses. J Food Prot. 2006;69(8):1808–1813.
- Carpenter CE, Smith JV, Broadbent JR. Efficacy of washing meat surfaces with 2% levulinic, acetic, or lactic acid for pathogen decontamination and residual growth inhibition. Meat Sci. 2011;88(2):256–260.
- Schmidt GR, Means WJ. Process for preparing algin/calcium gel structured meat products. July 1986.
- Mukherjee A, Yoon Y, Geornaras I, et al. Effect of meat binding formulations on thermal inactivation of Escherichia coli O157: H7 internalized in beef. J Food Sci. 2009;74(2).
- Ren K. Effect of Lactic Acid Source on Properties of Silver Carp Restructured with Alginate Gel. University of Missouri-Columbia; 2013.
- Rahman M. Preservation using chemicals and microbes. In: Handbook of Food Preservation. Boca Raton: Taylor and Francis Group, LLC; 2007:215-299.
- USDA-FSIS. Safe and suitable ingredients used in the production of meat, poultry, and egg products. http://www.fsis.usda.gov/wps/wcm/connect/bab10e09-aefa-483b-8be8-809a1f051d4c/7120.1.pdf?MOD=AJPERES. Published 2016. Accessed February 2, 2016.
- Barker SB, Summerson WH. The colorimetric determination of lactic acid in biological material. J Biol Chem. 1941;138:535–554.
- Yoshida H, Terashima M, Takahashi Production of organic acids and amino acids from fish meat by sub-critical water hydrolysis. Biotechnol Prog. 1999;15(6):1090–1094.
- Cunniff P. Official Methods of Analysis of AOAC International. 16th Gaithersburg, Md.: AOAC International; 1997.
- Huang H, Williams SK, Sims CA, et al. Sodium metasilicate affects antimicrobial, sensory, physical, and chemical characteristics of fresh commercial chicken breast meat stored at 4 C for 9 days. Poult Sci. 2011;90(5):1124–1133.
- Horwitz W. Official Methods of Analysis of AOAC International. 17th Gaithersburg, Md.: AOAC International; 2000.
- Vodnar DC, Paucean A, Dulf FV, et al. HPLC characterization of lactic acid formation and FTIR fingerprint of probiotic bacteria during fermentation processes. Not Bot Horti Agrobot Cluj-Napoca. 2010;38(2):109.
